Copyright
©The Author(s) 2021.
World J Diabetes. May 15, 2021; 12(5): 673-684
Published online May 15, 2021. doi: 10.4239/wjd.v12.i5.673
Published online May 15, 2021. doi: 10.4239/wjd.v12.i5.673
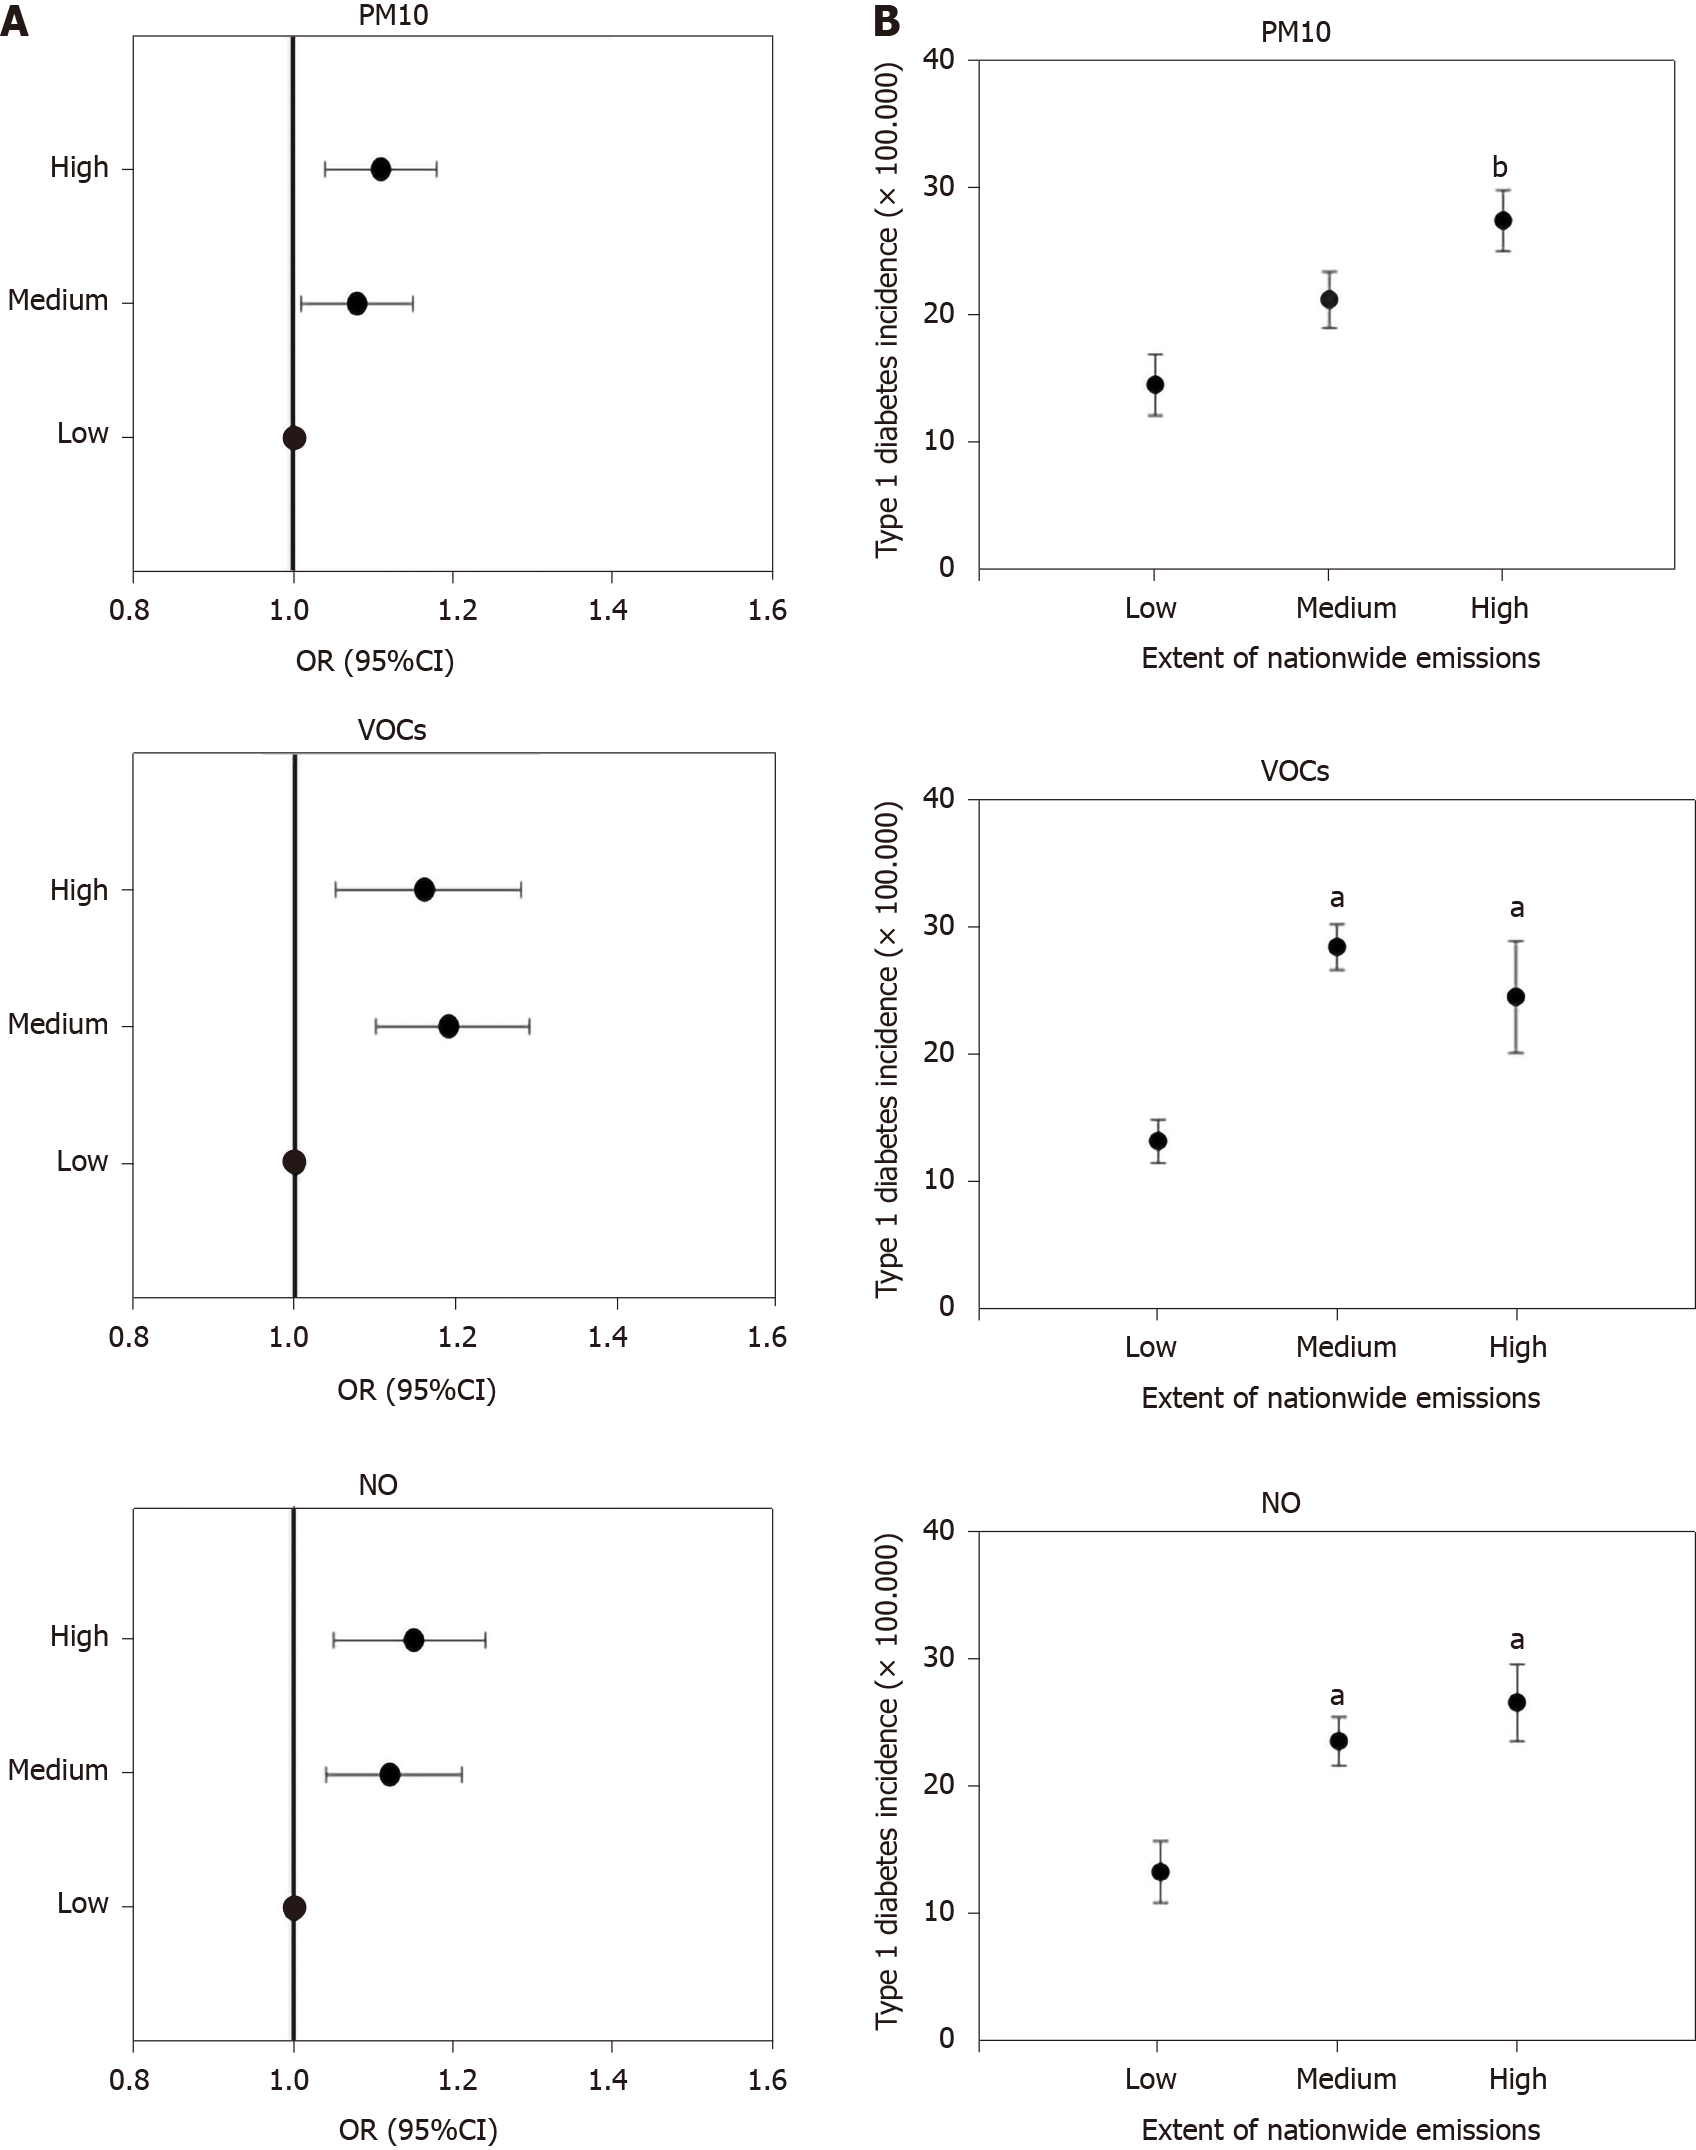
Figure 4 Odds ratios, 95% confidence interval, and incidence of type 1 diabetes in 19 European countries grouped according to tertiles of emissions of particulate matter < 10 μm, volatile organic compounds, and nitrogen oxides.
A: Odds ratios and 95% confidence intervals of type 1 diabetes incidence in 19 European countries grouped according to tertiles of particulate matter < 10 μm, volatile organic compounds, and nitrogen oxides (NO) emissions (total sector of emissions for each pollutant in each country). Values were calculated by logistic regression models, with type 1 diabetes incidence as the dependent variable, and tertiles of each pollutant (low, medium and high pollutant emissions) as the independent variable; B: Type 1 diabetes incidence in 19 European countries grouped according to tertiles (low, medium, high) of emissions of particulate matter < 10 μm, volatile organic compounds, and nitrogen oxides. The amount of pollutant emissions and the average type 1 diabetes incidence were calculated for each country in the same time period. Data are means ± standard error. aP < 0.05 vs countries in the low tertile of emissions (Kruskal-Wallis analysis of variance by ranks followed by multiple-comparison Z-value test); bP < 0.05 vs countries in the low and medium tertile of emissions. CI: Confidence interval; NO: Nitrogen oxides; OR: Odds ratios; PM10: Particulate matter < 10 μm; VOCs: Volatile organic compounds.
- Citation: Di Ciaula A, Portincasa P. Relationships between emissions of toxic airborne molecules and type 1 diabetes incidence in children: An ecologic study. World J Diabetes 2021; 12(5): 673-684
- URL: https://www.wjgnet.com/1948-9358/full/v12/i5/673.htm
- DOI: https://dx.doi.org/10.4239/wjd.v12.i5.673


