Copyright
©The Author(s) 2021.
World J Diabetes. May 15, 2021; 12(5): 673-684
Published online May 15, 2021. doi: 10.4239/wjd.v12.i5.673
Published online May 15, 2021. doi: 10.4239/wjd.v12.i5.673
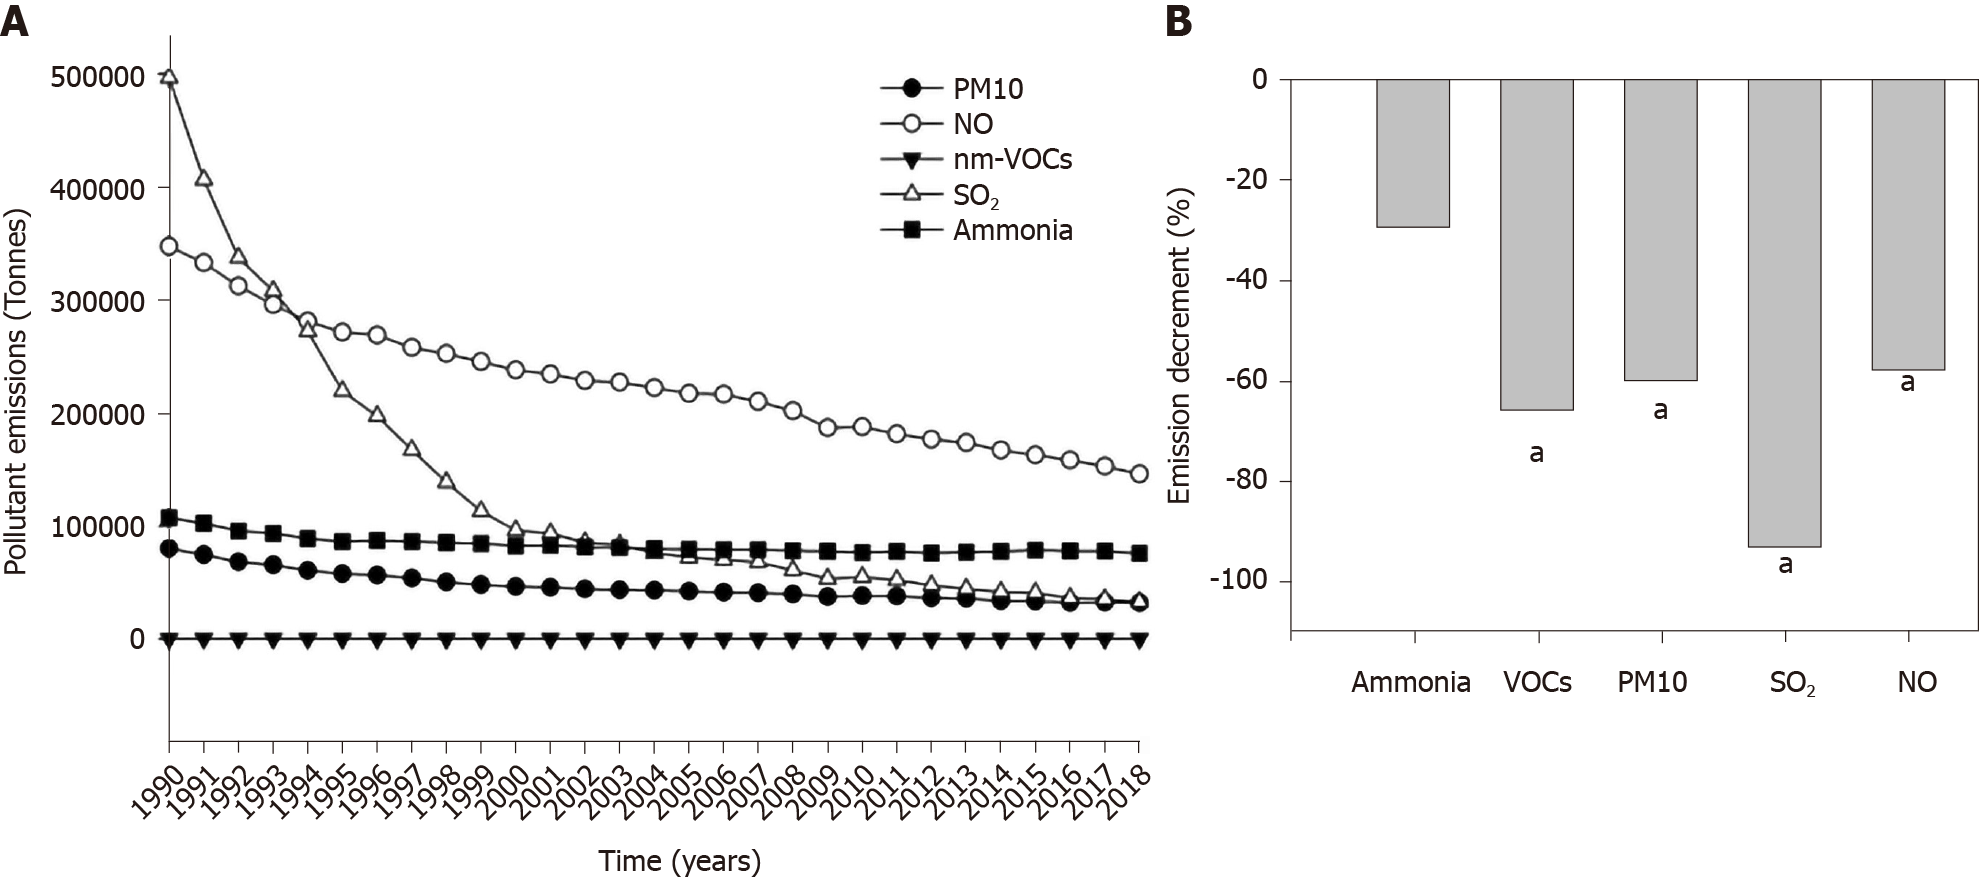
Figure 3 Pollutant emissions.
A: Time variations in the nationwide production of pollutants (tonnes per year, total sector of emissions for each pollutant) recorded in 19 European countries from 1990 to 2018. Symbols indicate average values; B: Percent decrement (2018 vs 1990) in the nationwide production of pollutants (aP < 0.05, last vs first year, Mann-Whitney). NO: Nitrogen oxides; PM10: Particulate matter < 10 μm; SO2: Sulphur oxide; VOCs: Volatile organic compounds.
- Citation: Di Ciaula A, Portincasa P. Relationships between emissions of toxic airborne molecules and type 1 diabetes incidence in children: An ecologic study. World J Diabetes 2021; 12(5): 673-684
- URL: https://www.wjgnet.com/1948-9358/full/v12/i5/673.htm
- DOI: https://dx.doi.org/10.4239/wjd.v12.i5.673


