Copyright
©The Author(s) 2021.
World J Diabetes. May 15, 2021; 12(5): 658-672
Published online May 15, 2021. doi: 10.4239/wjd.v12.i5.658
Published online May 15, 2021. doi: 10.4239/wjd.v12.i5.658
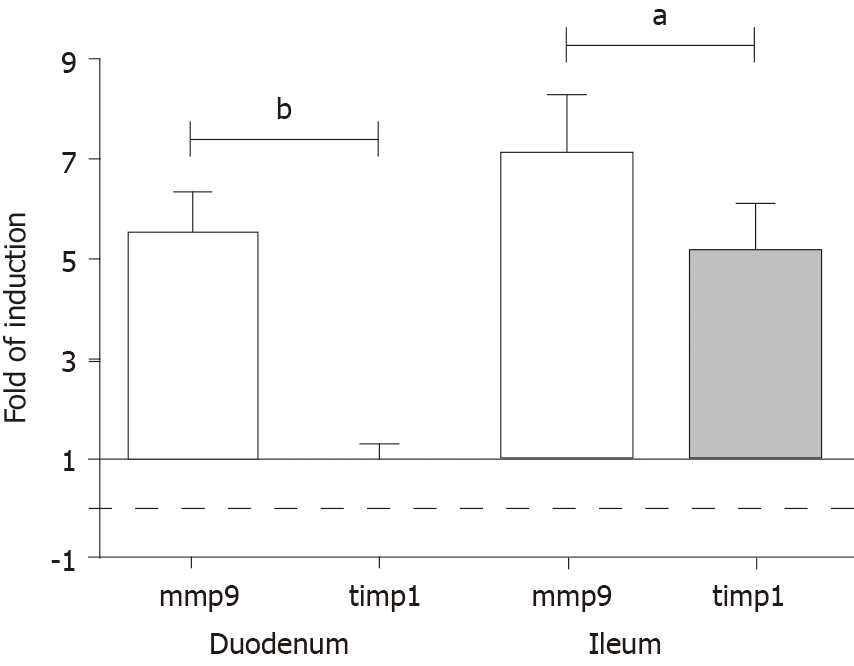
Figure 7 Fold change in the messenger ribonucleic acid levels of matrix metalloproteinase 9 and tissue inhibitor of metalloproteinase 1 genes, measured by real-time fluorescence-based quantitative polymerase chain reaction using the 2ΔΔCt method.
Data sets are presented as the fold change in gene expression normalized to the endogenous reference (RNA18S) and relative to the untreated controls. Data are expressed as means ± standard deviation. aP < 0.001 and bP < 0.0001.
- Citation: Bódi N, Mezei D, Chakraborty P, Szalai Z, Barta BP, Balázs J, Rázga Z, Hermesz E, Bagyánszki M. Diabetes-related intestinal region-specific thickening of ganglionic basement membrane and regionally decreased matrix metalloproteinase 9 expression in myenteric ganglia. World J Diabetes 2021; 12(5): 658-672
- URL: https://www.wjgnet.com/1948-9358/full/v12/i5/658.htm
- DOI: https://dx.doi.org/10.4239/wjd.v12.i5.658


