Copyright
©The Author(s) 2021.
World J Diabetes. Feb 15, 2021; 12(2): 124-137
Published online Feb 15, 2021. doi: 10.4239/wjd.v12.i2.124
Published online Feb 15, 2021. doi: 10.4239/wjd.v12.i2.124
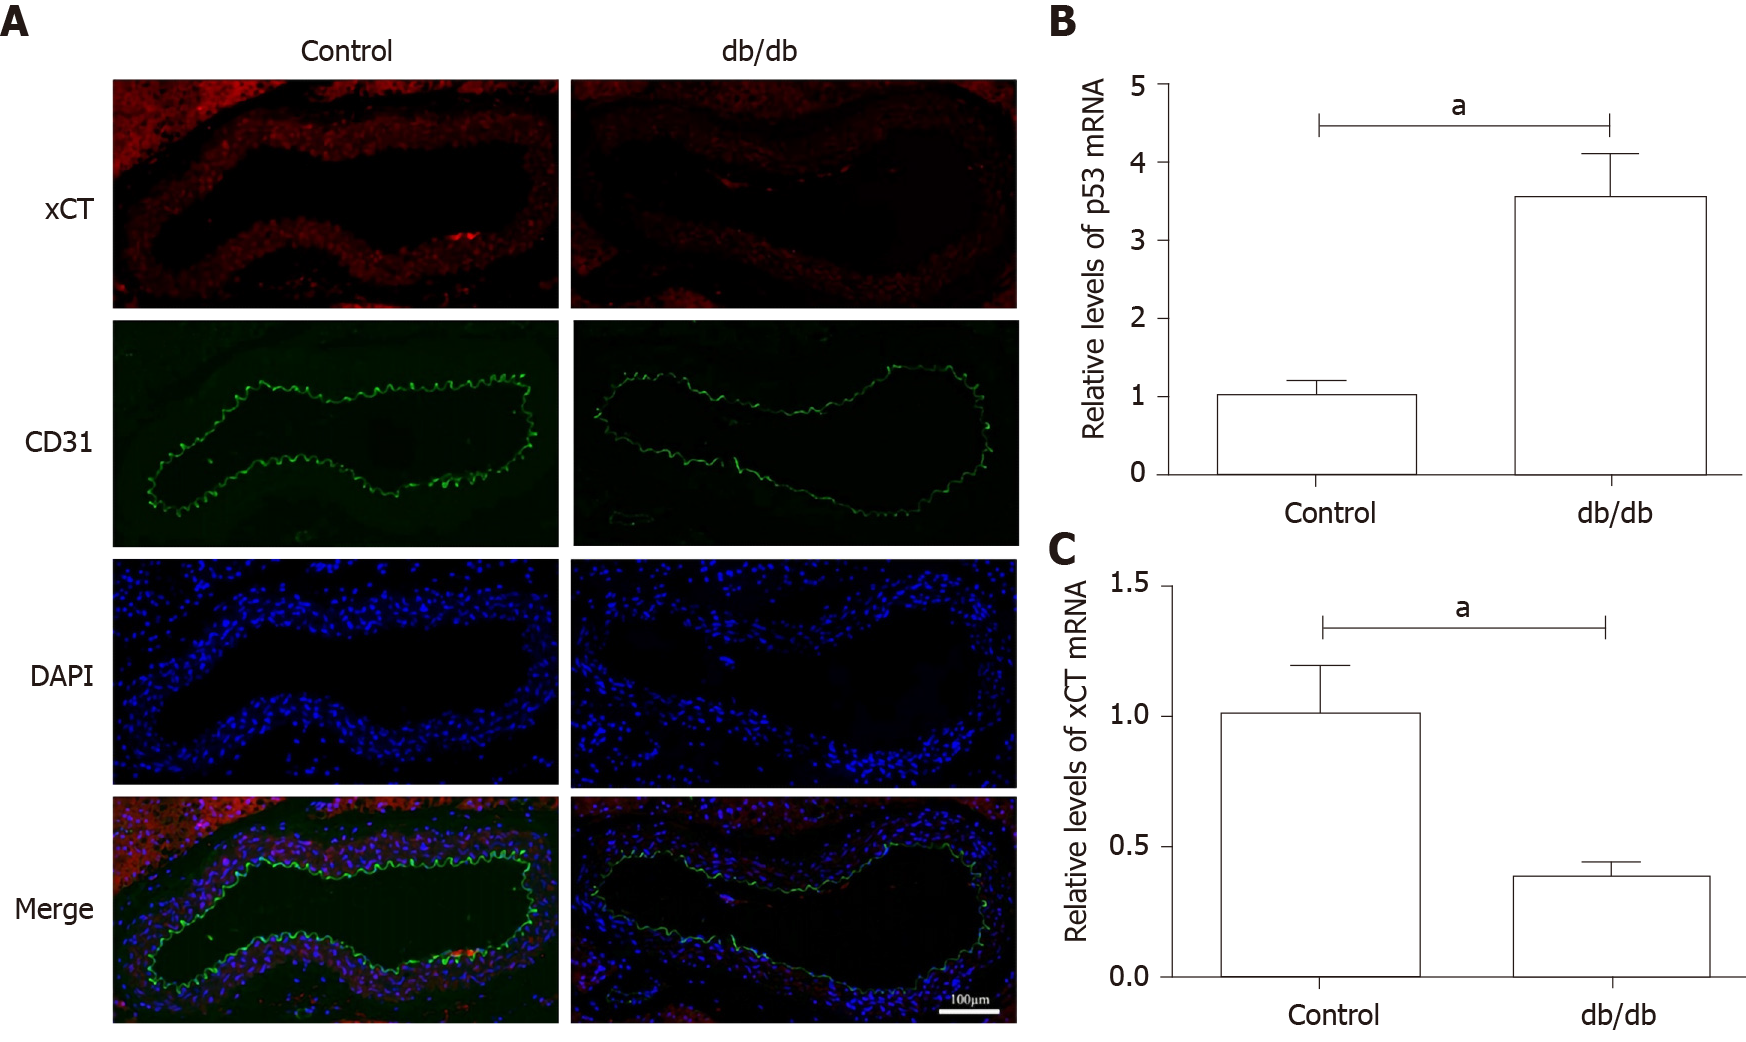
Figure 5 Detection of xCT (the substrate-specific subunit of system Xc-) and p53 expression in the aorta of db/db mice.
A: The localization of xCT was detected by immunofluorescence. xCT is labeled red, and CD31 is labeled green. The nucleus is labeled blue. Scale bar: 100 μm; B and C: The messenger ribonucleic acid levels of p53 and xCT in mice aorta were determined using real-time polymerase chain reaction analyses. β-actin was used for normalization. aP < 0.05 vs the control group. bP < 0.01 vs the control group.
- Citation: Luo EF, Li HX, Qin YH, Qiao Y, Yan GL, Yao YY, Li LQ, Hou JT, Tang CC, Wang D. Role of ferroptosis in the process of diabetes-induced endothelial dysfunction. World J Diabetes 2021; 12(2): 124-137
- URL: https://www.wjgnet.com/1948-9358/full/v12/i2/124.htm
- DOI: https://dx.doi.org/10.4239/wjd.v12.i2.124


