Copyright
©The Author(s) 2020.
World J Diabetes. Sep 15, 2020; 11(9): 374-390
Published online Sep 15, 2020. doi: 10.4239/wjd.v11.i9.374
Published online Sep 15, 2020. doi: 10.4239/wjd.v11.i9.374
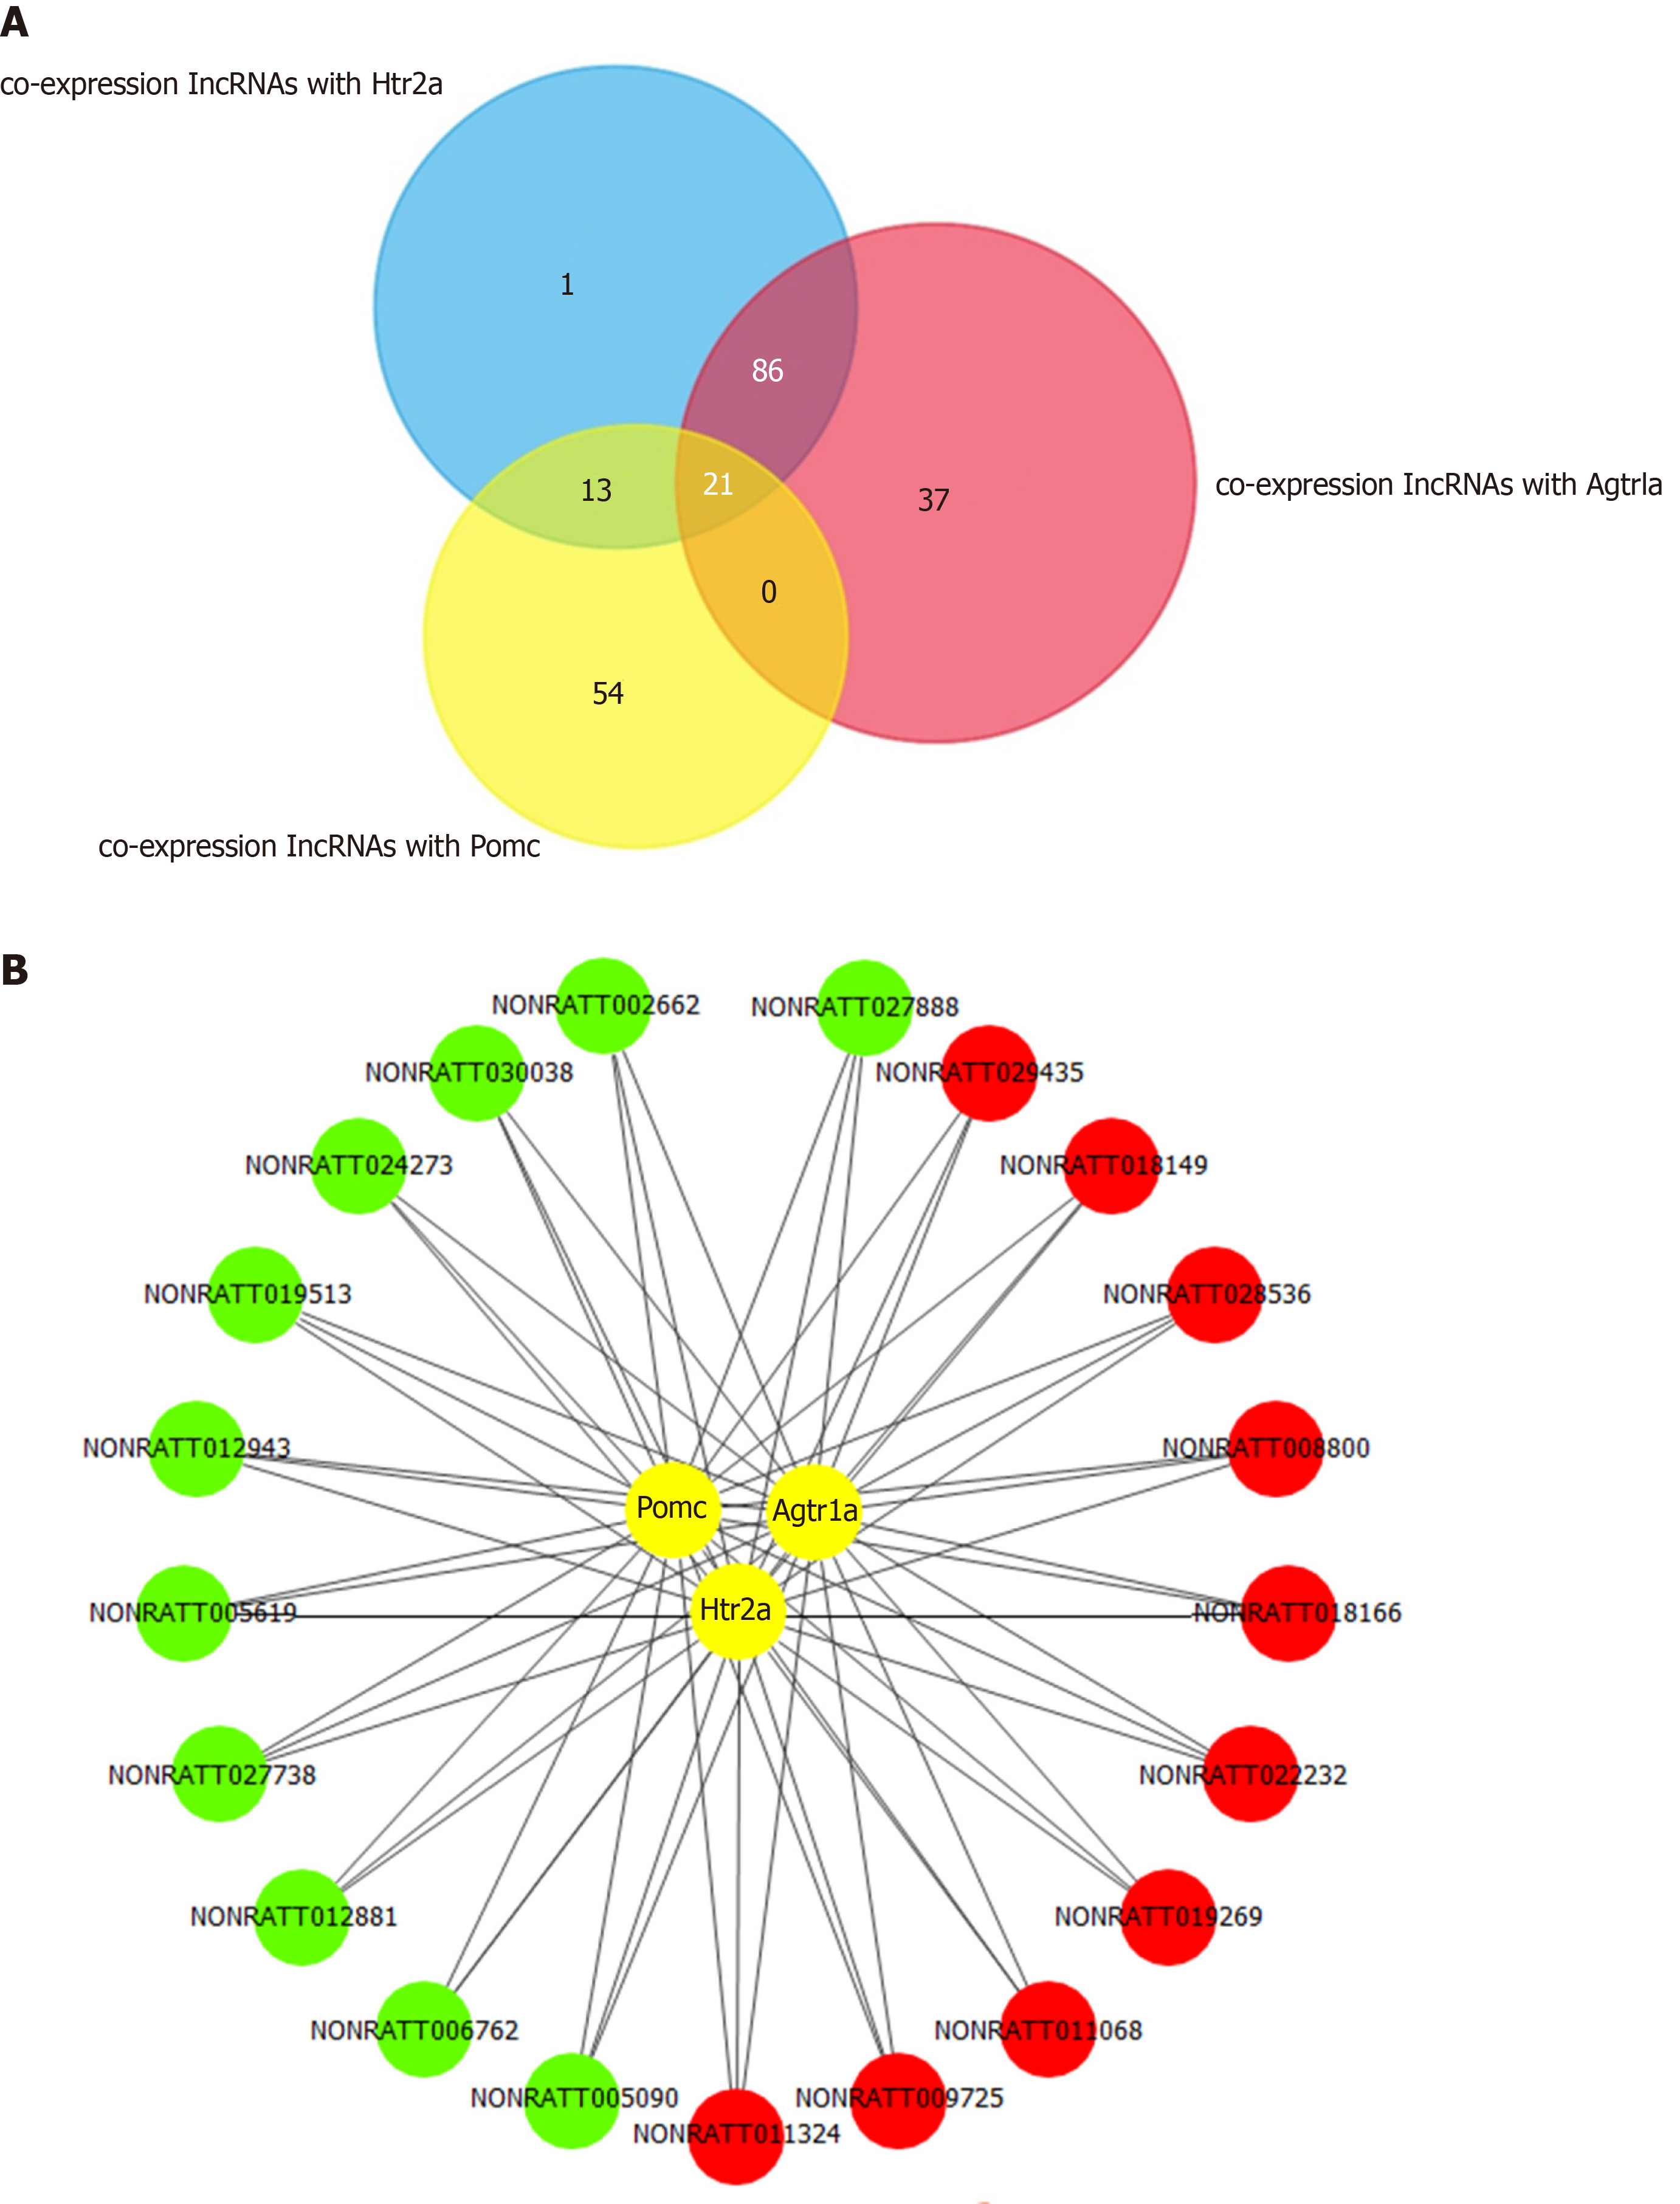
Figure 5 Co-expression network of long noncoding RNAs and hub mRNAs.
A: Venn diagram of co-expressed long noncoding RNAs (lncRNAs) with Pomc, Htr2a, and Agtr1a. A co-expression network was constructed based on the Pearson coefficient with the filter condition as P value < 0.05 and |R| > 0.90. Twenty-one common lncRNAs were obtained by intersecting the co-expressed lncRNAs of Pomc, Htr2a, and Agtr1a. B: The 21 common lncRNAs co-expressed with Pomc, Htr2a, and Agtr1a, including 11 downregulated and 10 upregulated lncRNAs. Red circles represent upregulated lncRNAs, whereas the green circles represent downregulated lncRNAs.
- Citation: Cui LJ, Bai T, Zhi LP, Liu ZH, Liu T, Xue H, Yang HH, Yang XH, Zhang M, Niu YR, Liu YF, Zhang Y. Analysis of long noncoding RNA-associated competing endogenous RNA network in glucagon-like peptide-1 receptor agonist-mediated protection in β cells. World J Diabetes 2020; 11(9): 374-390
- URL: https://www.wjgnet.com/1948-9358/full/v11/i9/374.htm
- DOI: https://dx.doi.org/10.4239/wjd.v11.i9.374


