Copyright
©The Author(s) 2020.
World J Diabetes. Sep 15, 2020; 11(9): 374-390
Published online Sep 15, 2020. doi: 10.4239/wjd.v11.i9.374
Published online Sep 15, 2020. doi: 10.4239/wjd.v11.i9.374
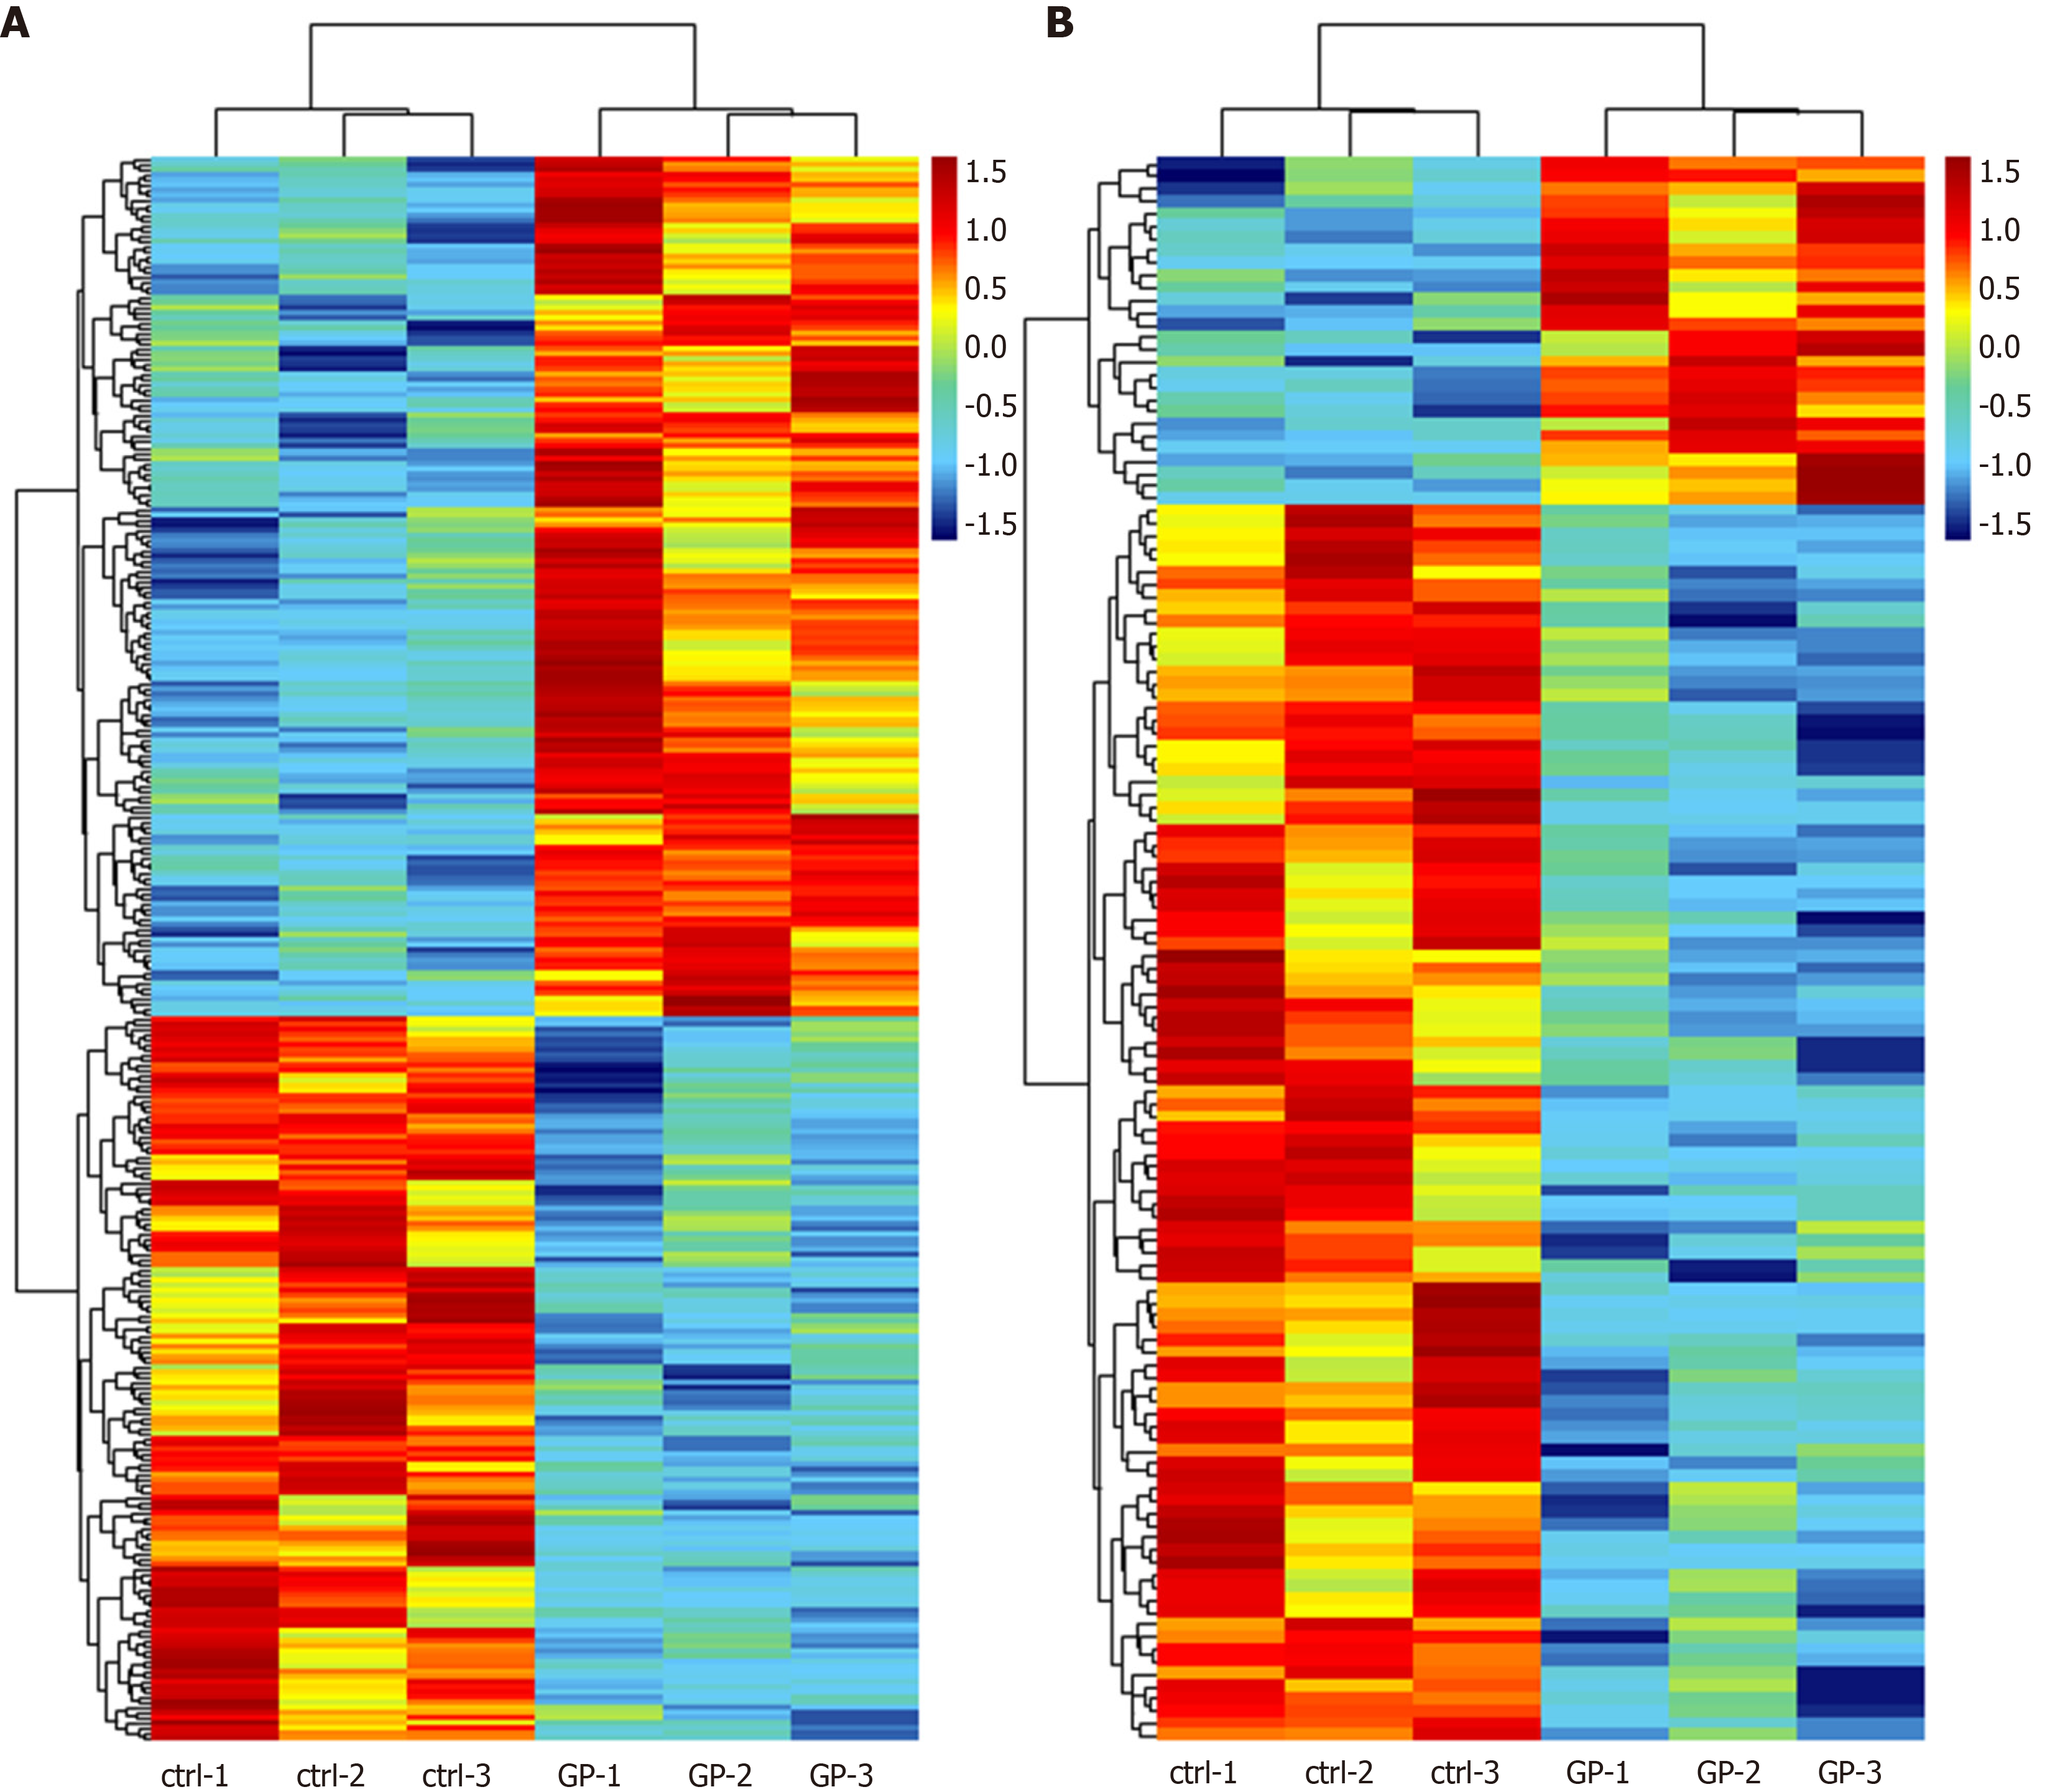
Figure 1 Heatmap of differentially expressed long noncoding RNAs (A) and mRNAs (B).
A: A total of 167 upregulated and 141 downregulated long noncoding RNAs were identified in the geniposide-treated group (GP1 to GP3) compared to the control group (ctrl-1 to ctrl-3) with fold change filter set at ≥ 1.5 and P value < 0.05. B: A total of 28 upregulated and 100 downregulated mRNAs were identified with the same filter settings.
- Citation: Cui LJ, Bai T, Zhi LP, Liu ZH, Liu T, Xue H, Yang HH, Yang XH, Zhang M, Niu YR, Liu YF, Zhang Y. Analysis of long noncoding RNA-associated competing endogenous RNA network in glucagon-like peptide-1 receptor agonist-mediated protection in β cells. World J Diabetes 2020; 11(9): 374-390
- URL: https://www.wjgnet.com/1948-9358/full/v11/i9/374.htm
- DOI: https://dx.doi.org/10.4239/wjd.v11.i9.374


