Copyright
©The Author(s) 2020.
World J Diabetes. May 15, 2020; 11(5): 182-192
Published online May 15, 2020. doi: 10.4239/wjd.v11.i5.182
Published online May 15, 2020. doi: 10.4239/wjd.v11.i5.182
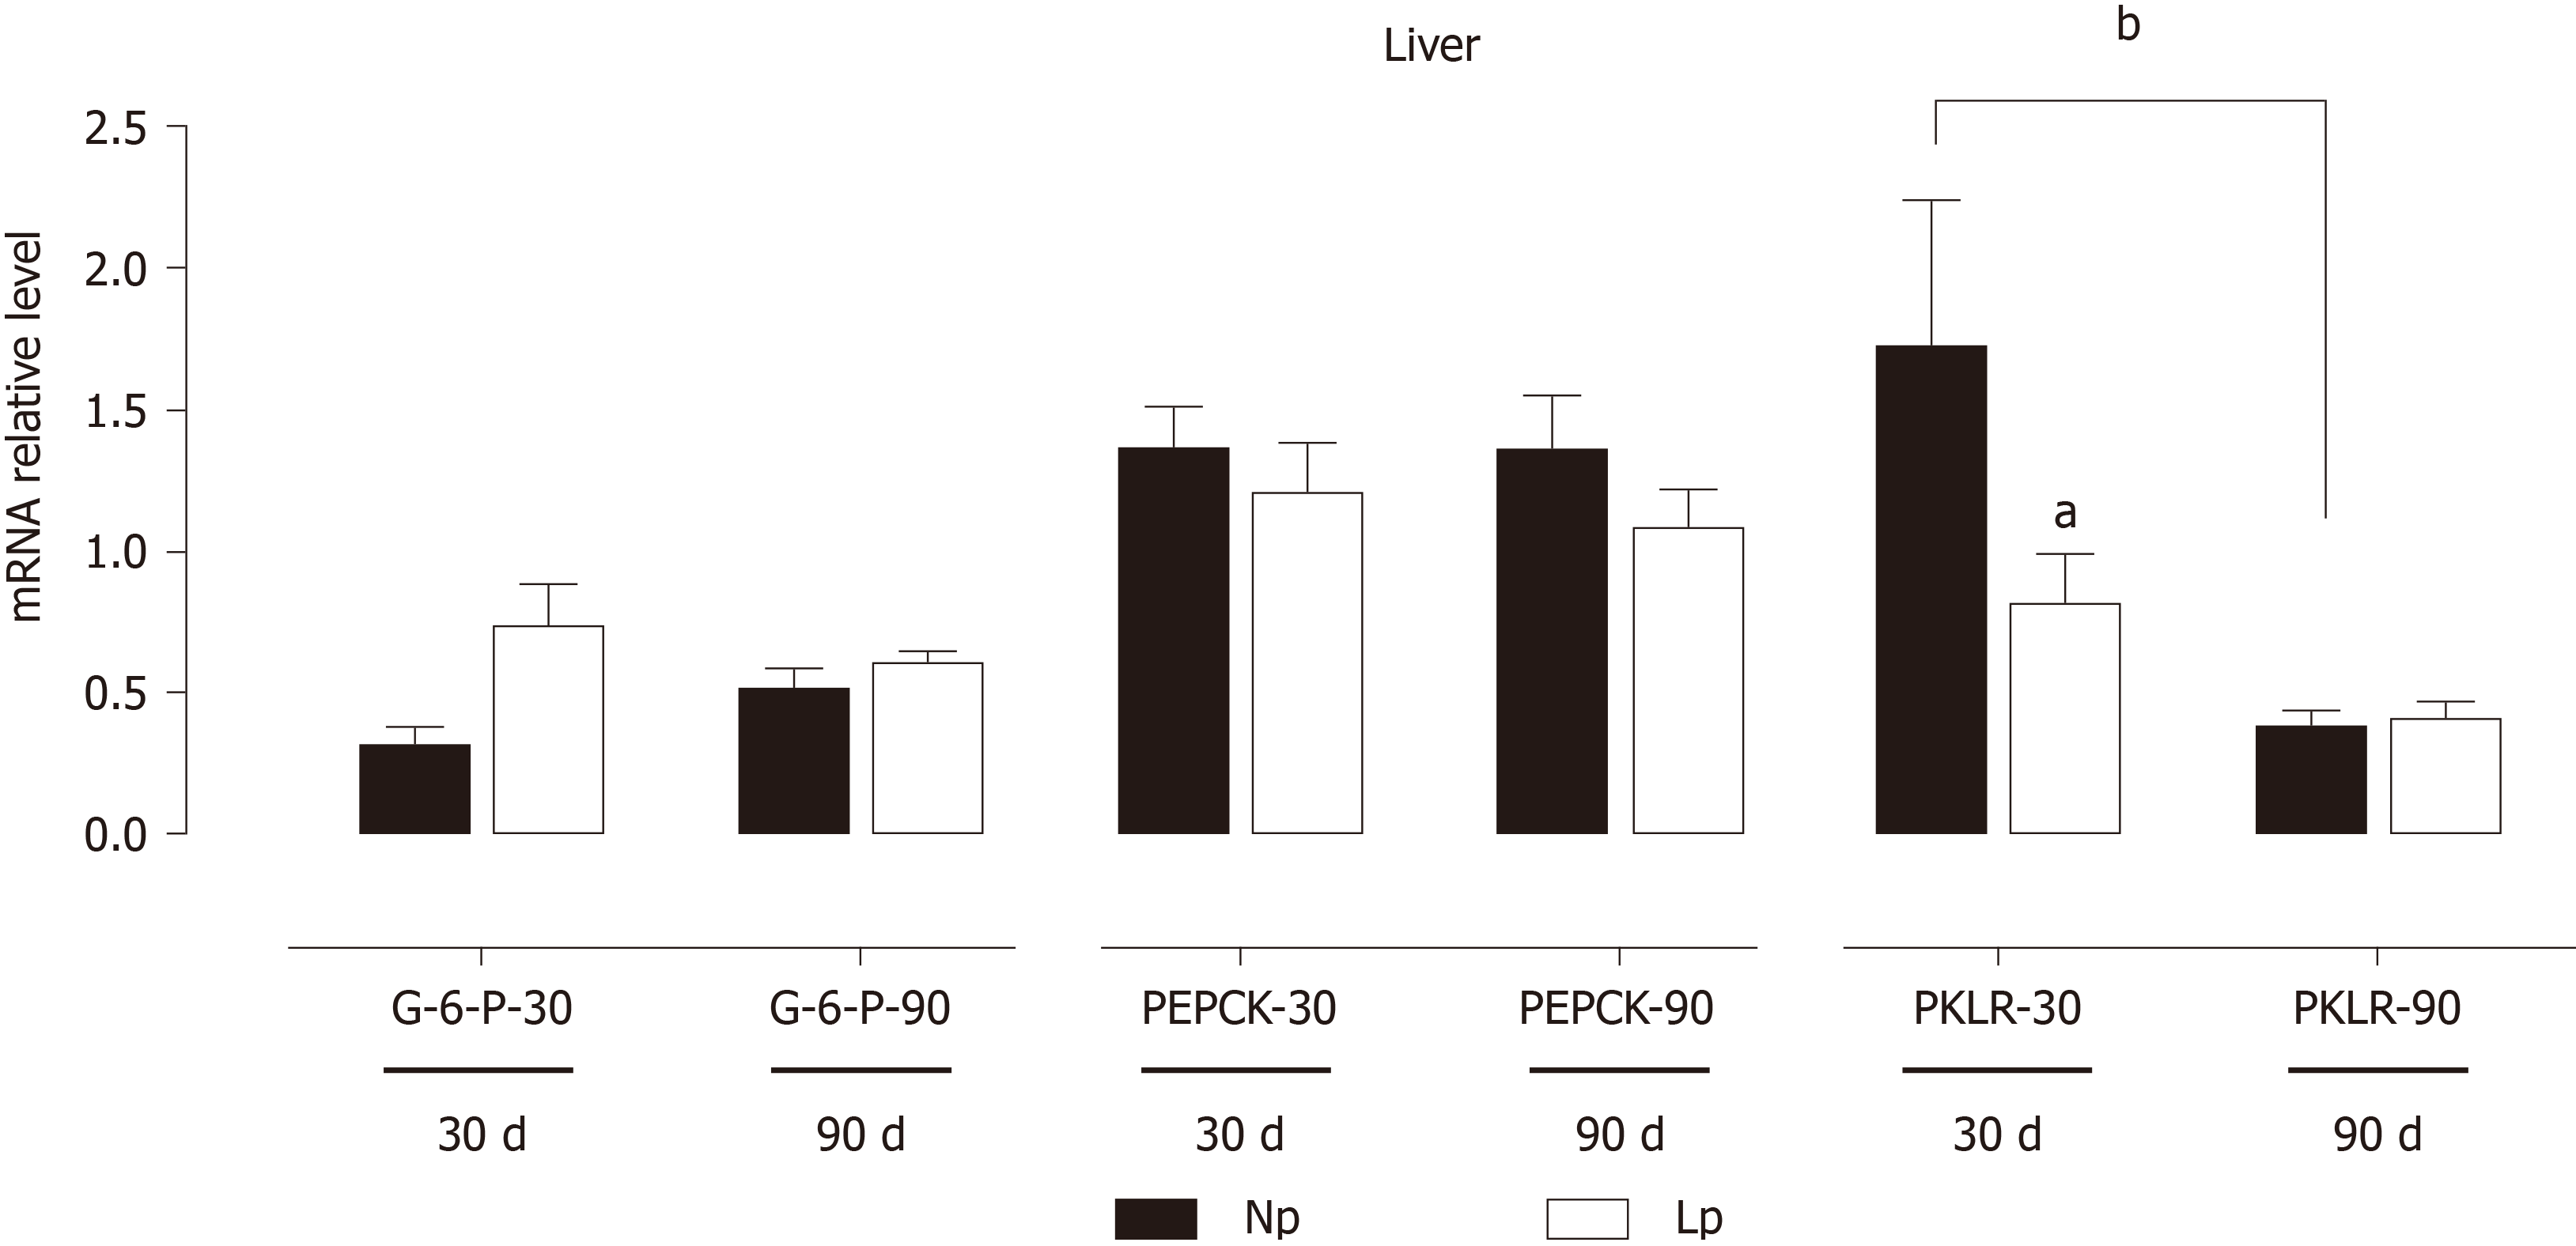
Figure 8 Expression of gluconeogenic genes in the liver of rats.
Rats were exposed to maternal low protein diet during gestation and lactation, and gene expression of glucose 6-phosphatase, phosphoenolpyruvate carboxykinase and pyruvate kinase L/R was analyzed by quantitative reverse transcription PCR. Data are shown as mean ± standard error means and analyzed by two-way ANOVA with the mother’s diet (normal protein; low protein) and age (30 d, 90 d) as variable factors. Bonferroni’s post hoc test was used. Differences between diet groups are indicated by asterisks; differences between ages are indicated by bars. aP < 0.05, bP < 0.01. NP: Normal protein; LP: Low protein; G6Pase: Glucose 6-phosphatase; PEPCK: Phosphoenolpyruvate carboxykinase; PKLR: Pyruvate kinase L/R.
- Citation: de Oliveira Lira A, de Brito Alves JL, Pinheiro Fernandes M, Vasconcelos D, Santana DF, da Costa-Silva JH, Morio B, Góis Leandro C, Pirola L. Maternal low protein diet induces persistent expression changes in metabolic genes in male rats. World J Diabetes 2020; 11(5): 182-192
- URL: https://www.wjgnet.com/1948-9358/full/v11/i5/182.htm
- DOI: https://dx.doi.org/10.4239/wjd.v11.i5.182


