Copyright
©The Author(s) 2020.
World J Diabetes. May 15, 2020; 11(5): 182-192
Published online May 15, 2020. doi: 10.4239/wjd.v11.i5.182
Published online May 15, 2020. doi: 10.4239/wjd.v11.i5.182
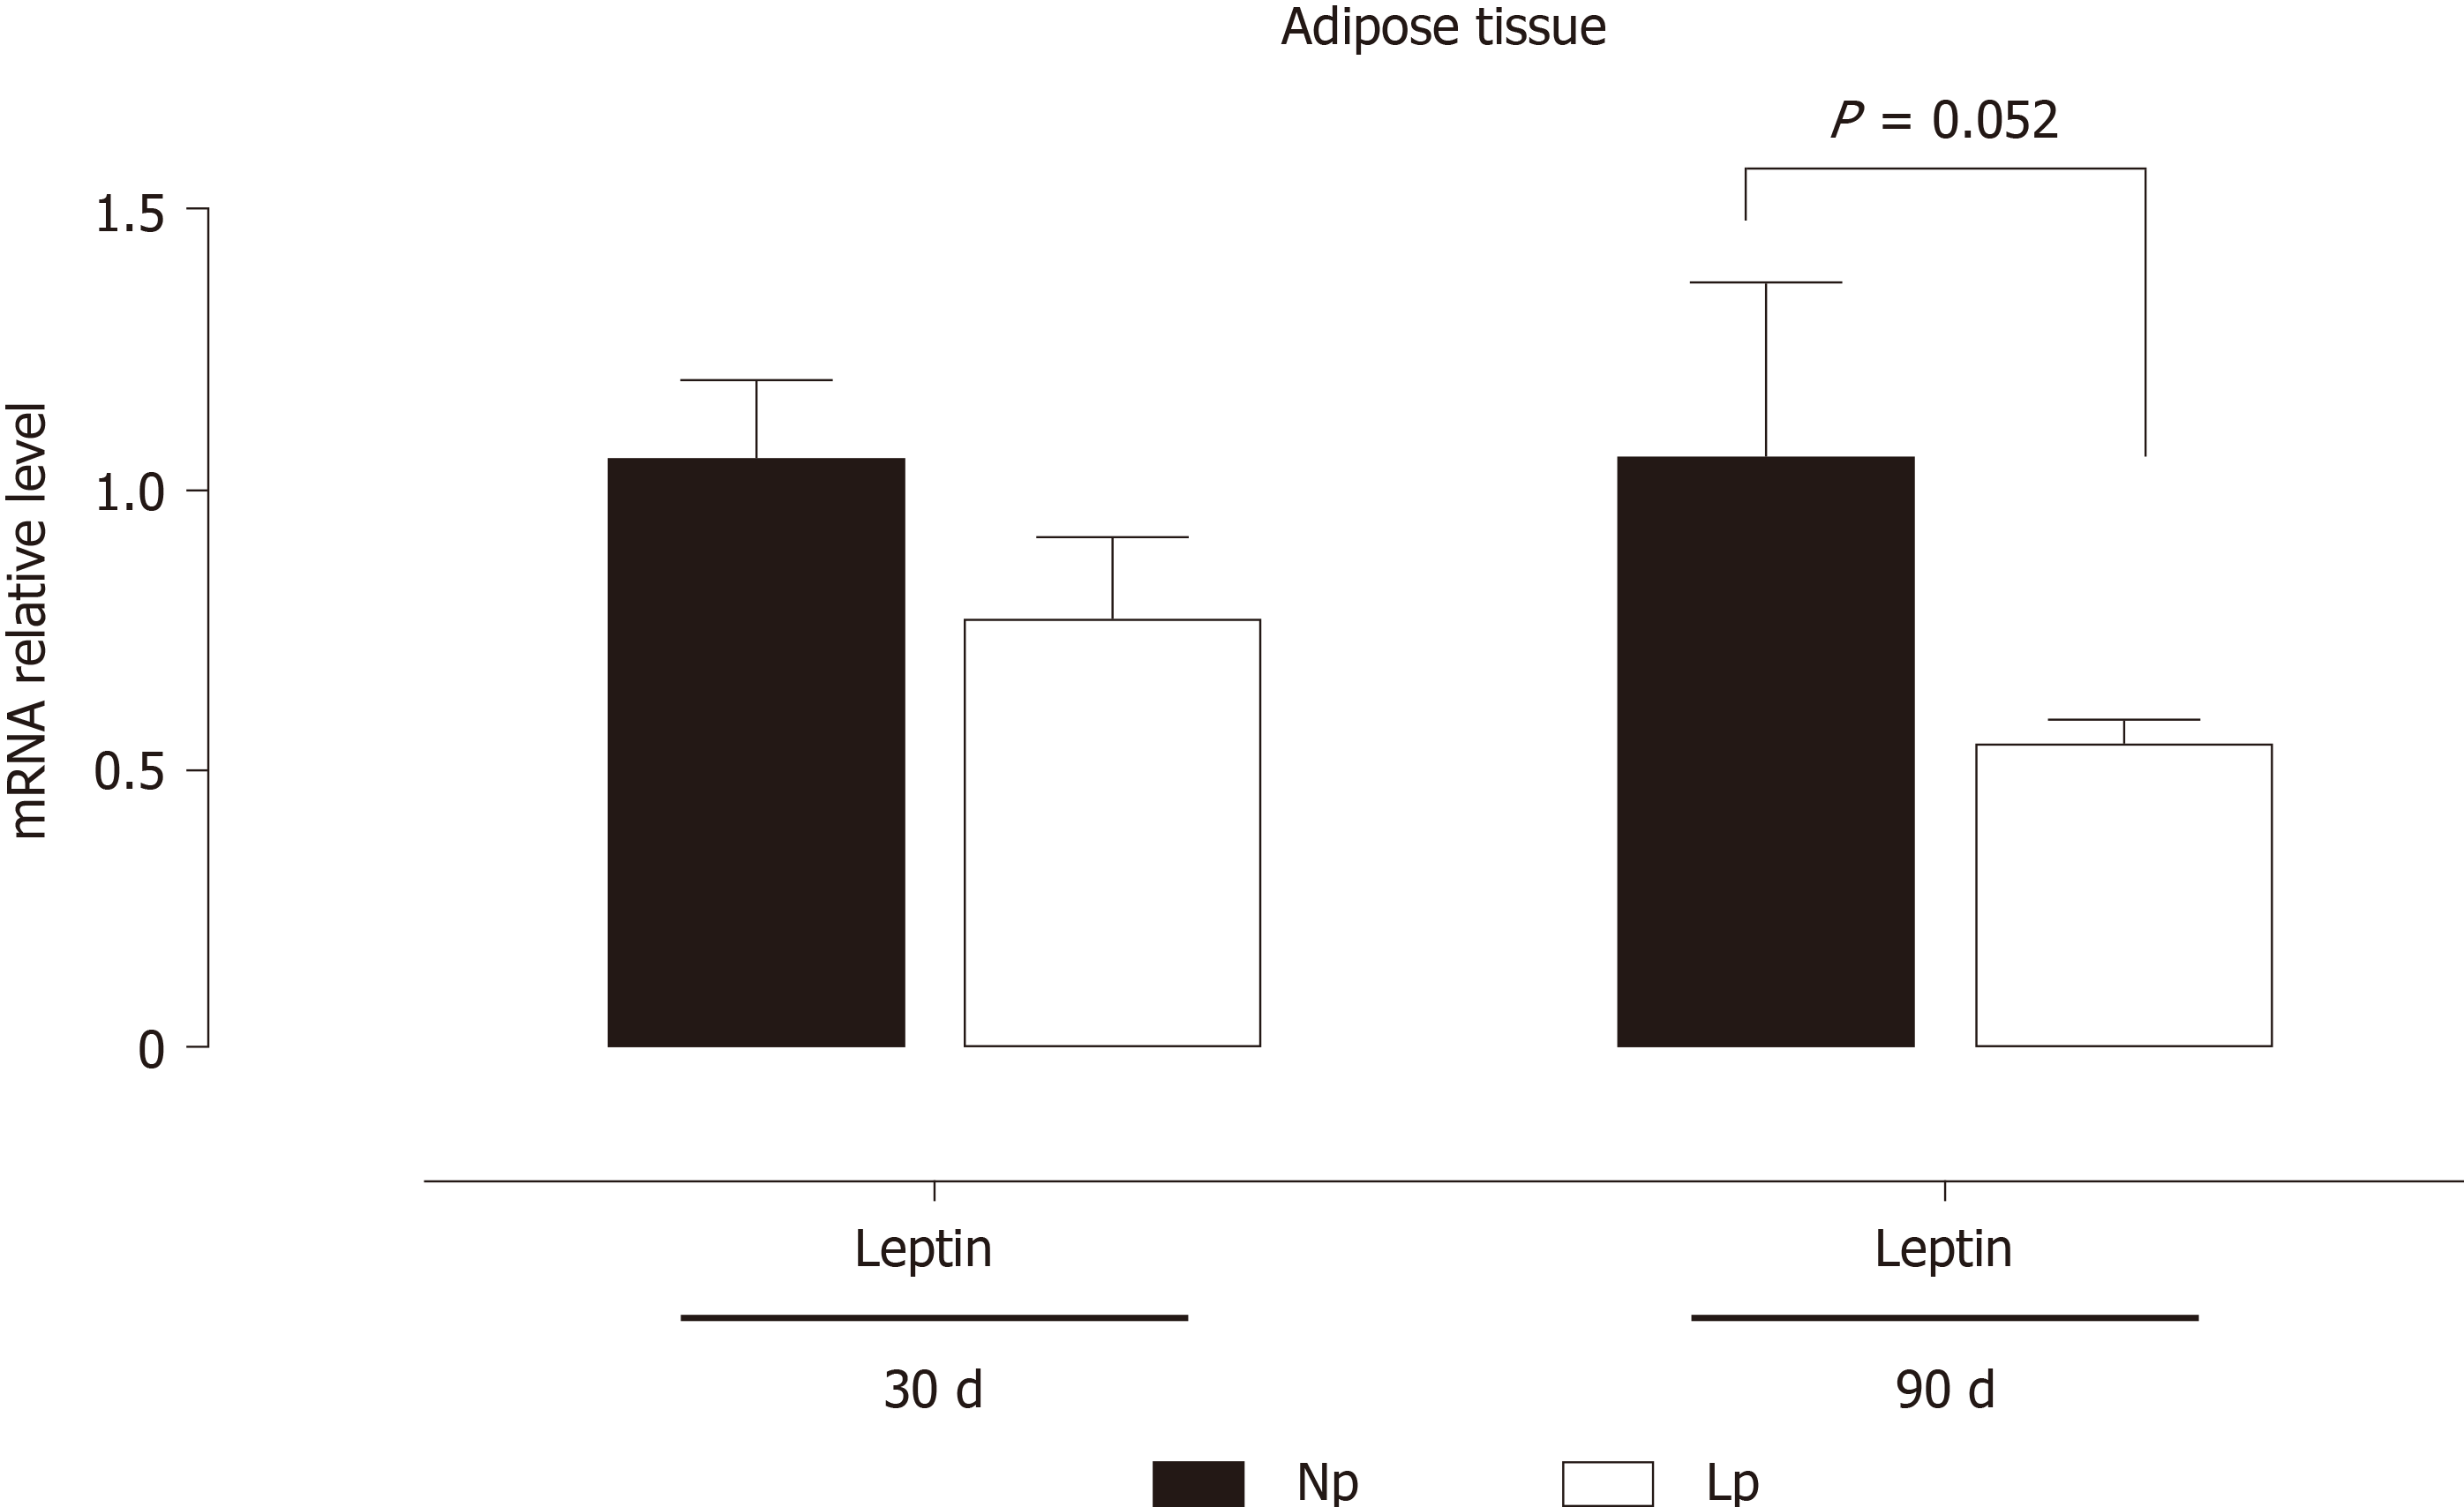
Figure 4 Gene expression of leptin in adipose tissue of rats.
Rats were exposed to maternal low protein diet during gestation and lactation, and gene expression of leptin from adipose tissue was analyzed by quantitative reverse transcription PCR. Data are shown as mean ± standard error means and analyzed by two-way ANOVA with the mother’s diet (normal protein; low protein) and age (30 d, 90 d) as variable factors. Bonferroni’s post hoc test was used. Differences between diet groups are indicated by asterisks. NP: Normal protein; LP: Low protein.
- Citation: de Oliveira Lira A, de Brito Alves JL, Pinheiro Fernandes M, Vasconcelos D, Santana DF, da Costa-Silva JH, Morio B, Góis Leandro C, Pirola L. Maternal low protein diet induces persistent expression changes in metabolic genes in male rats. World J Diabetes 2020; 11(5): 182-192
- URL: https://www.wjgnet.com/1948-9358/full/v11/i5/182.htm
- DOI: https://dx.doi.org/10.4239/wjd.v11.i5.182


