Copyright
©The Author(s) 2020.
World J Diabetes. Apr 15, 2020; 11(4): 126-136
Published online Apr 15, 2020. doi: 10.4239/wjd.v11.i4.126
Published online Apr 15, 2020. doi: 10.4239/wjd.v11.i4.126
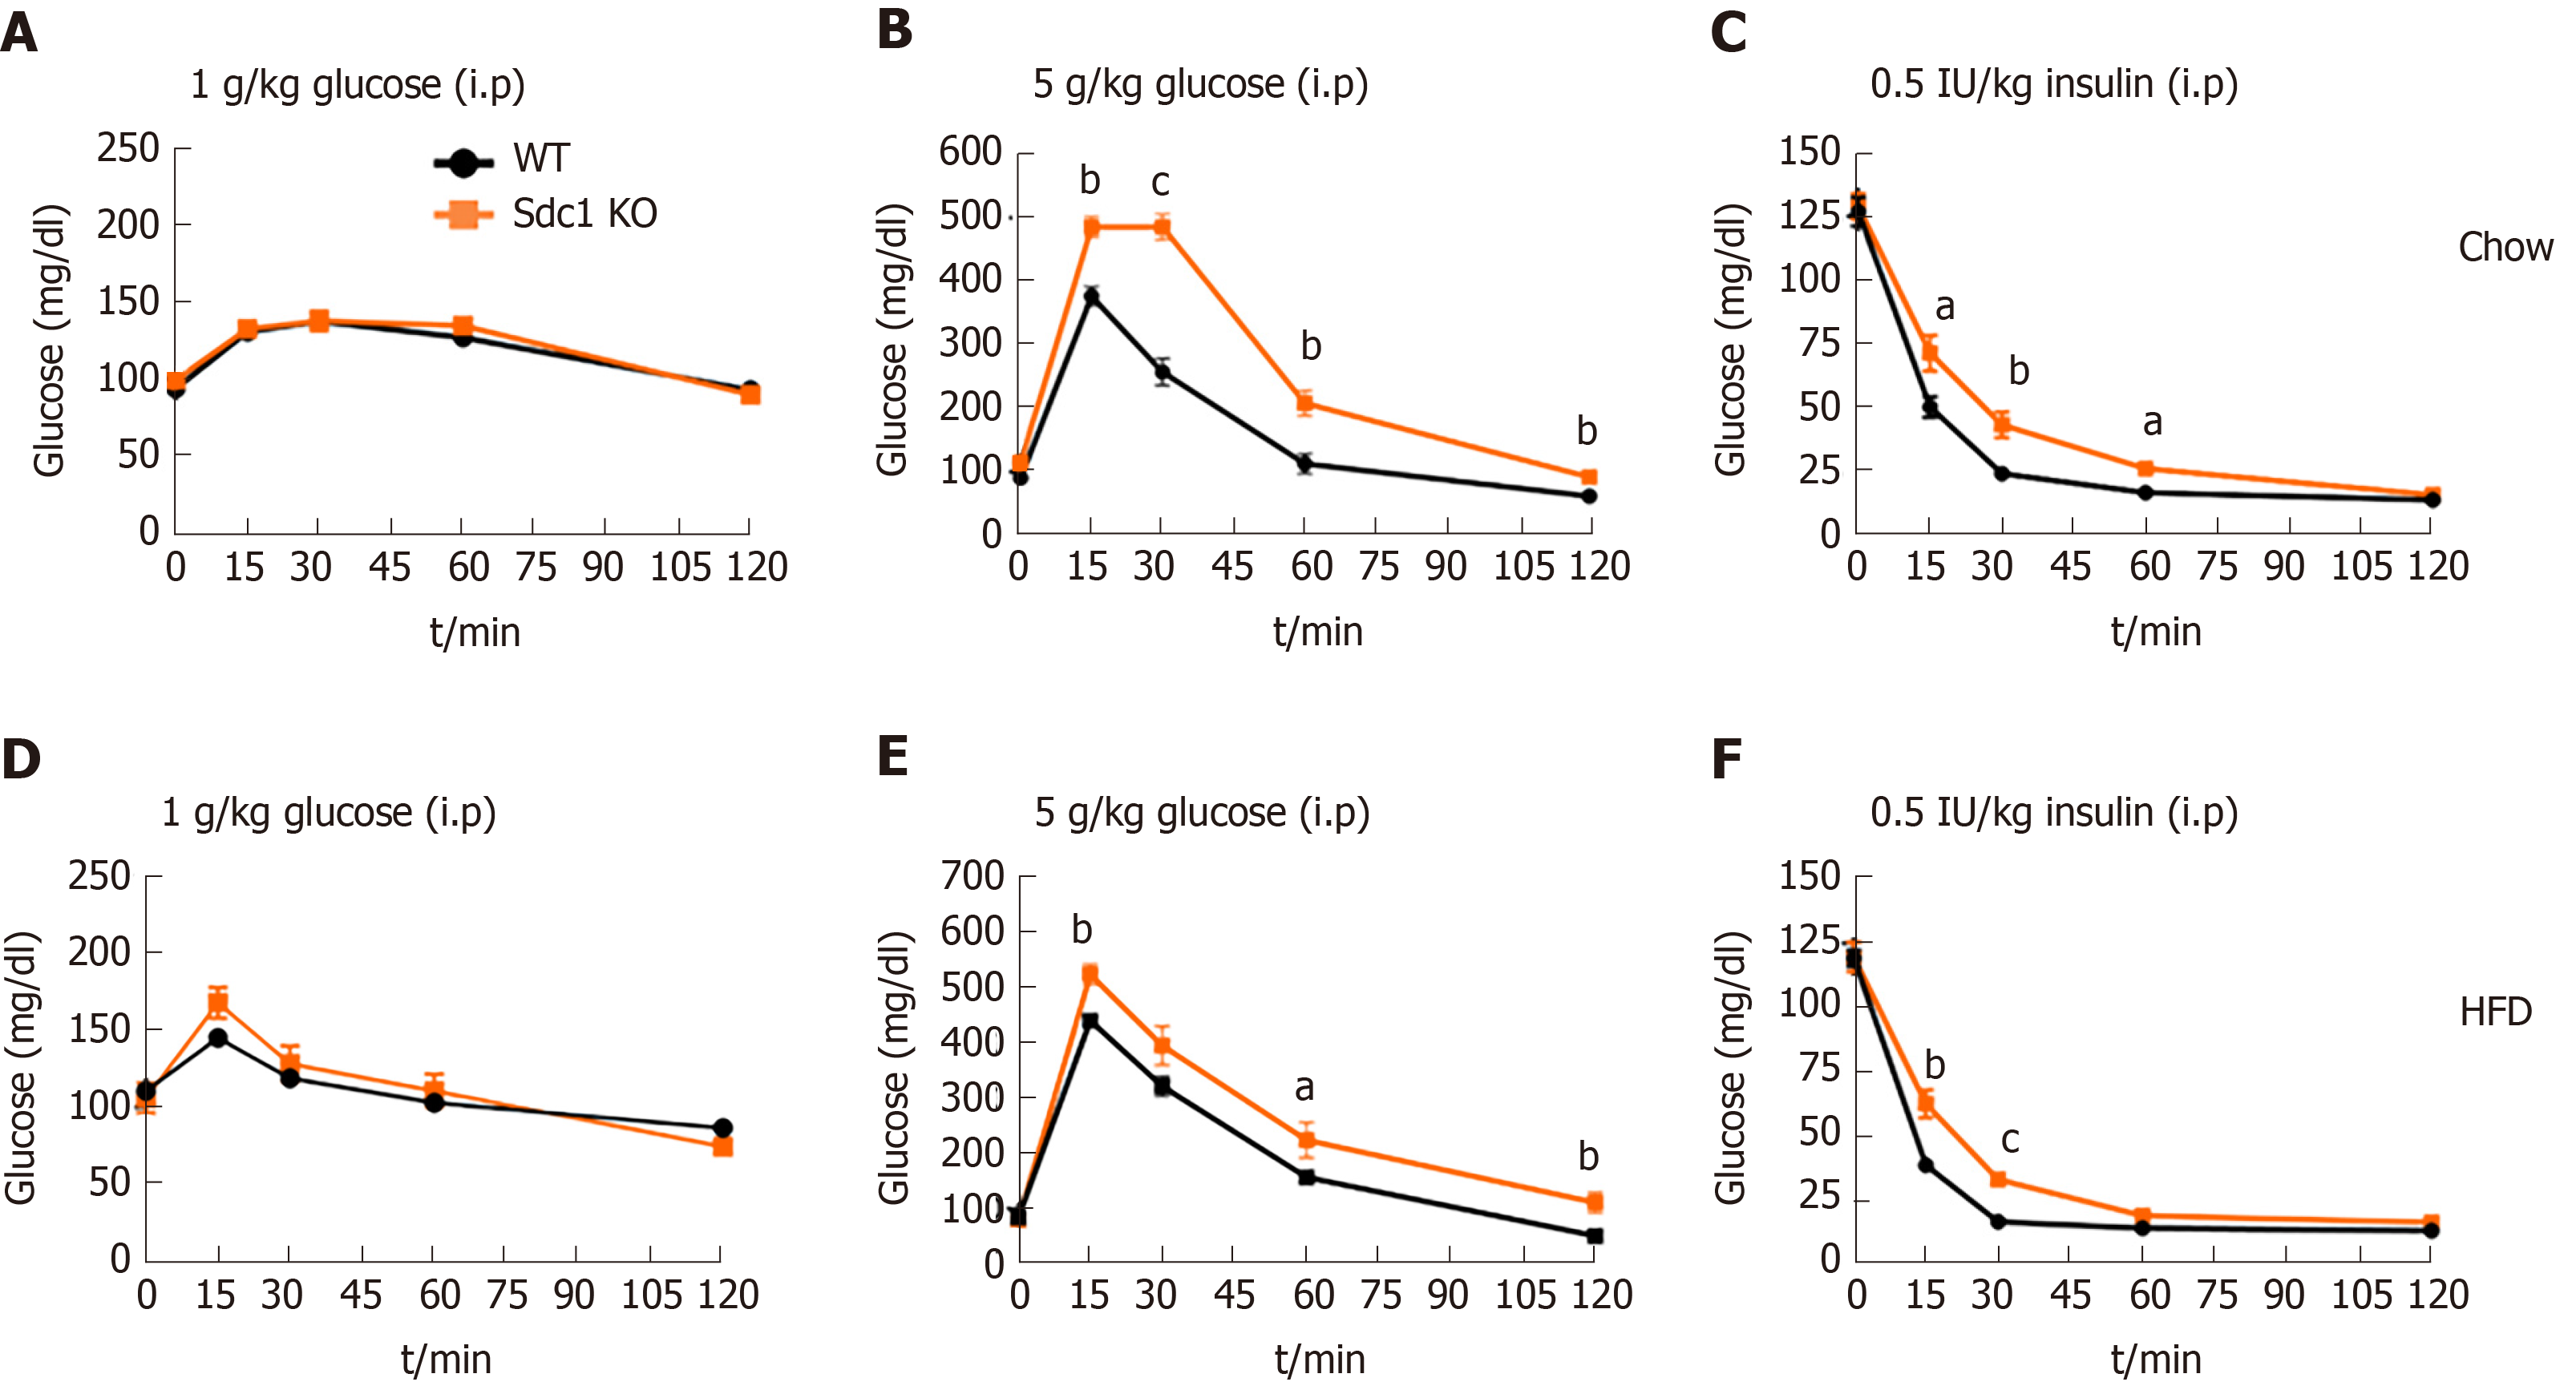
Figure 6 Glucose tolerance test and insulin tolerance test on chow and high-fat diet.
A: Graph shows glucose tolerance pattern in Sdc1 knockout mice and wild type mice, when fed with chow-diet; B: High-fat diet up to 8 wks; C: Insulin tolerance test pattern when mice were fed with chow; D: High-fat diet. Graphs show cumulative data two independent experiments of total 24 female BALB/c mice (mean ± SE). Unpaired t test (Two-tailed); cP < 0.001, bP < 0.01, aP < 0.05. Sdc1 KO: Sdc1 knockout; HFD: High-fat diet; WT: Wild type.
- Citation: Jaiswal AK, Sadasivam M, Aja S, Hamad ARA. Lack of Syndecan-1 produces significant alterations in whole-body composition, metabolism and glucose homeostasis in mice. World J Diabetes 2020; 11(4): 126-136
- URL: https://www.wjgnet.com/1948-9358/full/v11/i4/126.htm
- DOI: https://dx.doi.org/10.4239/wjd.v11.i4.126


