Copyright
©The Author(s) 2020.
World J Diabetes. Apr 15, 2020; 11(4): 126-136
Published online Apr 15, 2020. doi: 10.4239/wjd.v11.i4.126
Published online Apr 15, 2020. doi: 10.4239/wjd.v11.i4.126
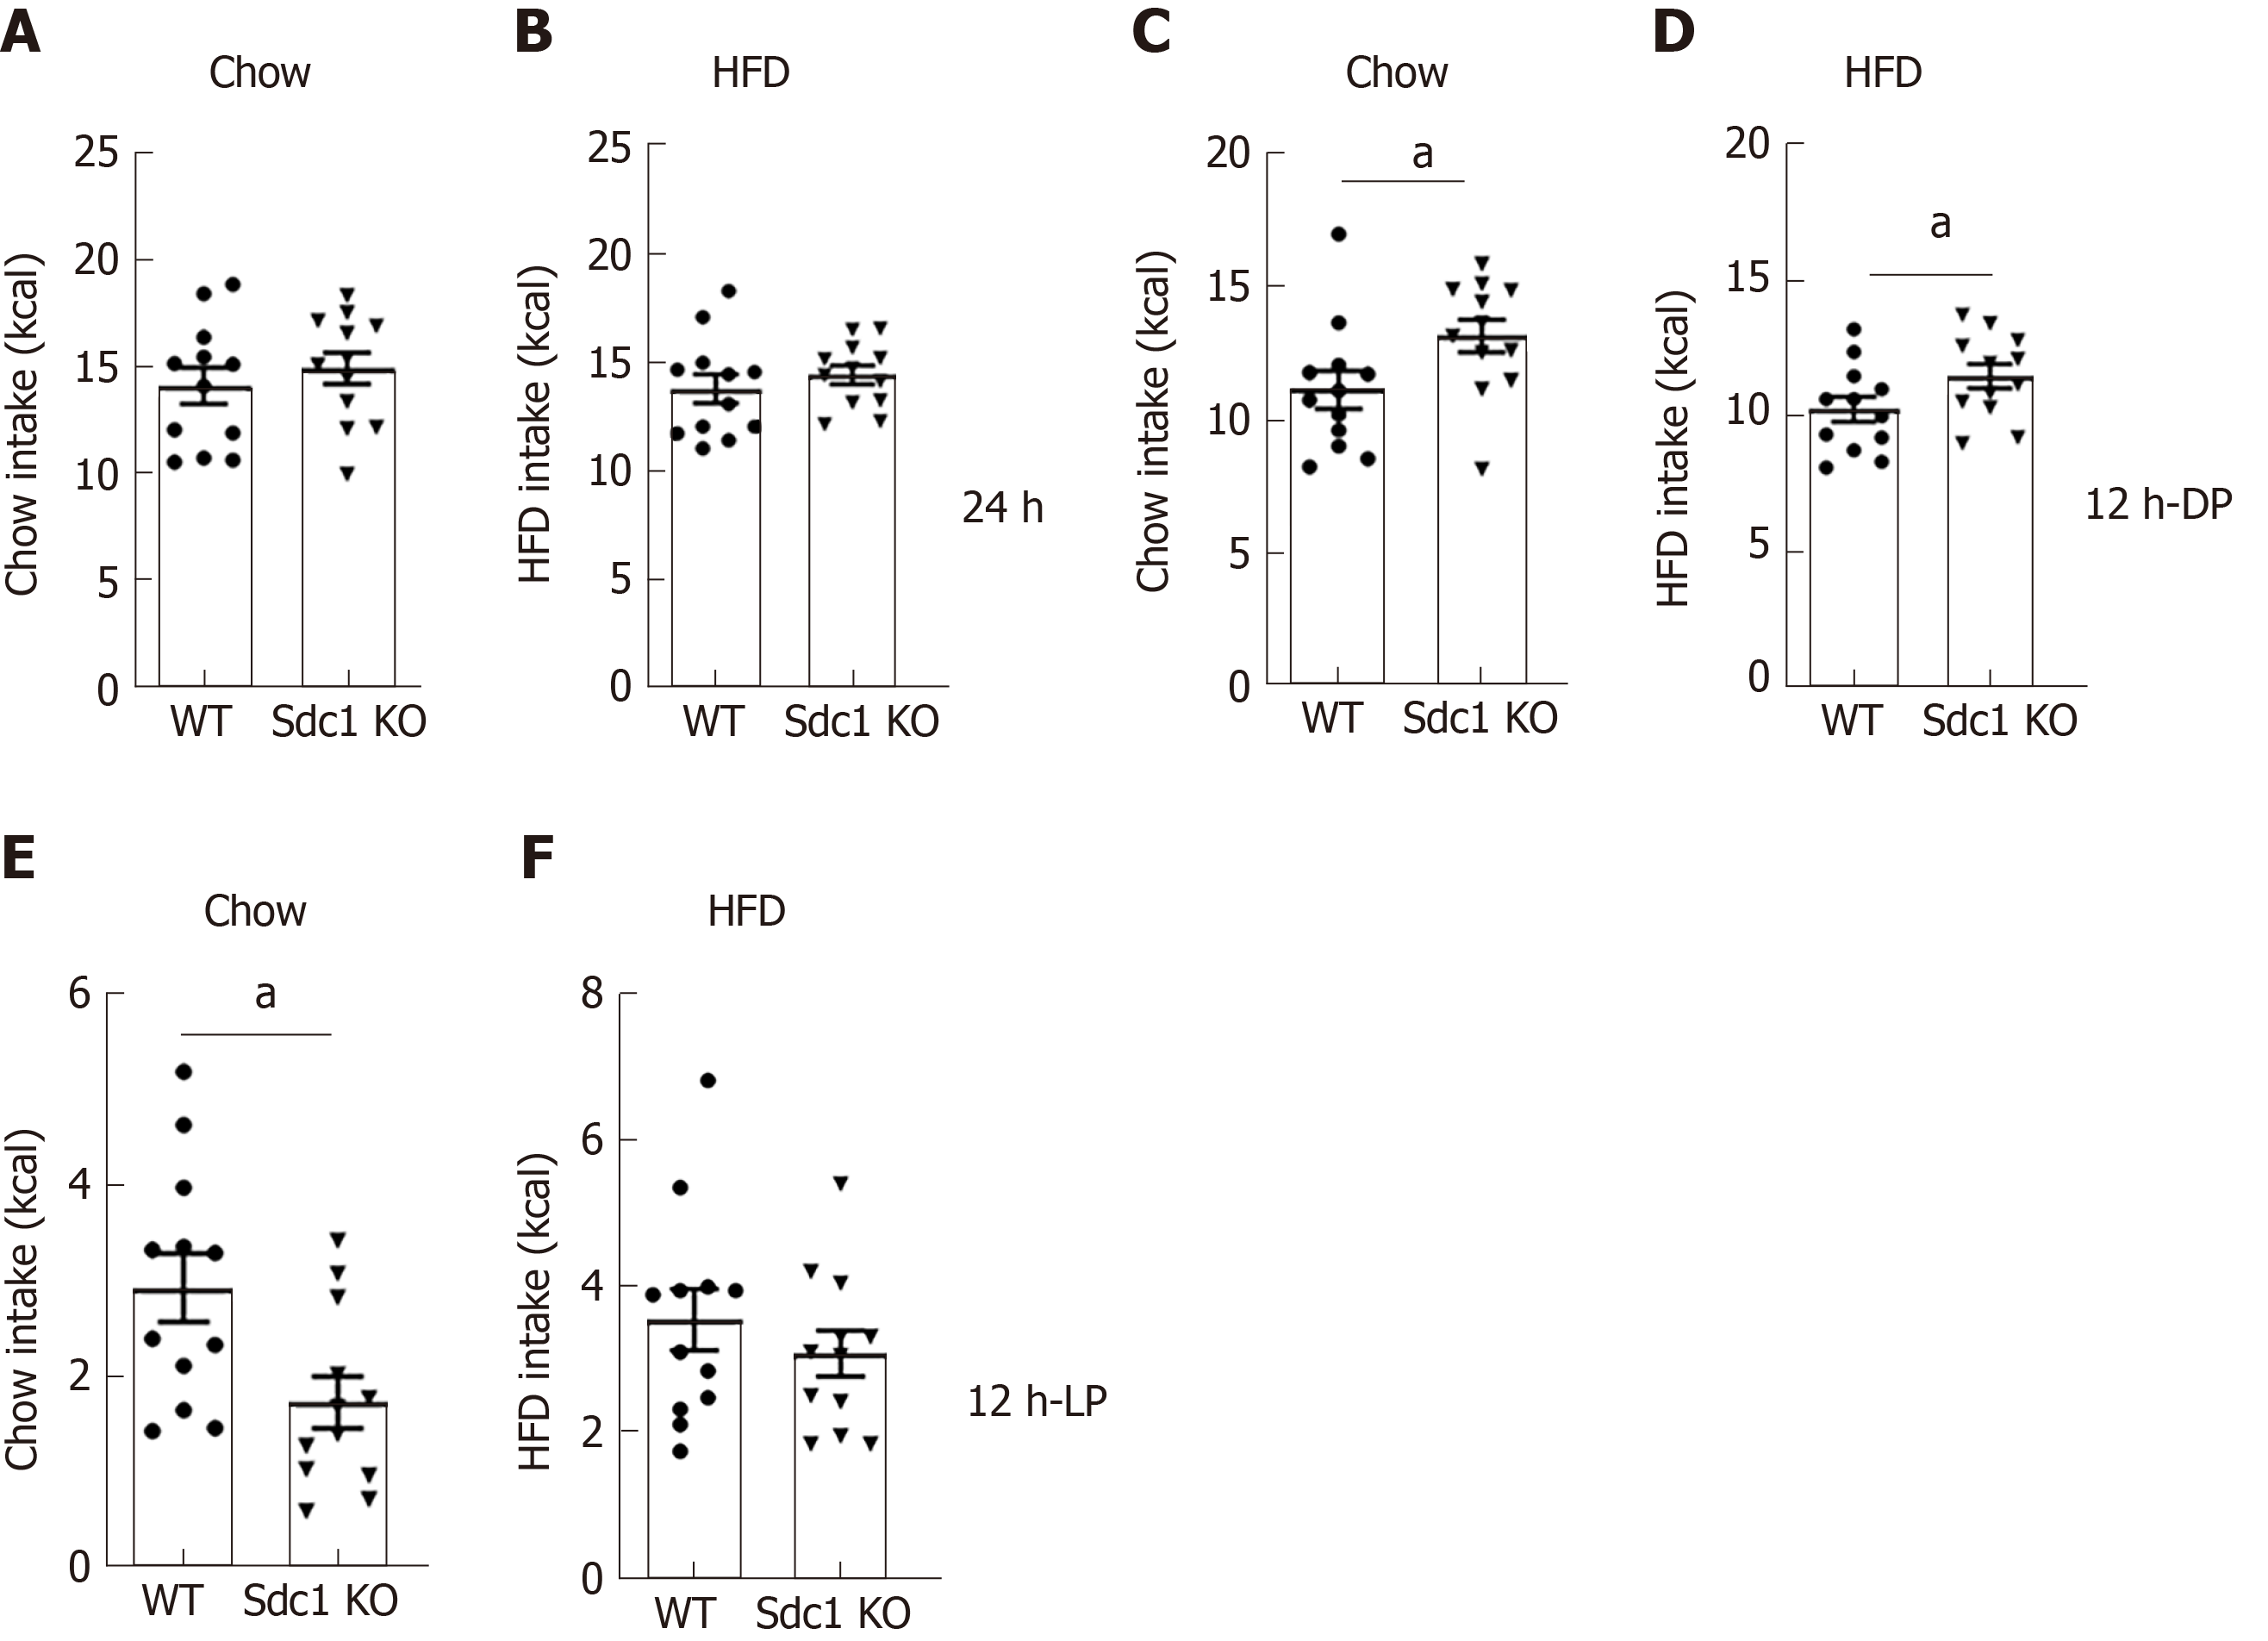
Figure 2 Energy intake on chow-fed and high fat-fed diets.
Age matched Sdc1 knockout (Sdc1 KO), wild type (WT) mice kept on both chow and high-fat diet (HFD) for 8 wk and then indirect calorimetry was performed using the Oxymax/CLAMS system. Daily energy intake and body weight were monitored in each mice of each genotypes. Measurements were performed over 4 consecutive days following a 24-h acclimation period and are shown food intake, normalized to body weight (kcal/g BW) or lean mass (kcal/g lean) measured by QNMRI immediately prior to calorimetry. A, B: Graphs shows cumulative food intake (kcal) measured in Sdc1 KO and WT mice fed with chow and HFD; C, D: Cumulative food intake (kcal) in Sdc1 KO and WT mice on chow and HFD during 12 h dark; E, F: 12 h light phases of day cycle. Data represents mean ± SE of total 12 animals of each genotype. aP < 0.05. Sdc1 KO: Sdc1 knockout; HFD: High-fat diet; WT: Wild type.
- Citation: Jaiswal AK, Sadasivam M, Aja S, Hamad ARA. Lack of Syndecan-1 produces significant alterations in whole-body composition, metabolism and glucose homeostasis in mice. World J Diabetes 2020; 11(4): 126-136
- URL: https://www.wjgnet.com/1948-9358/full/v11/i4/126.htm
- DOI: https://dx.doi.org/10.4239/wjd.v11.i4.126


