Copyright
©The Author(s) 2020.
World J Diabetes. Dec 15, 2020; 11(12): 654-665
Published online Dec 15, 2020. doi: 10.4239/wjd.v11.i12.654
Published online Dec 15, 2020. doi: 10.4239/wjd.v11.i12.654
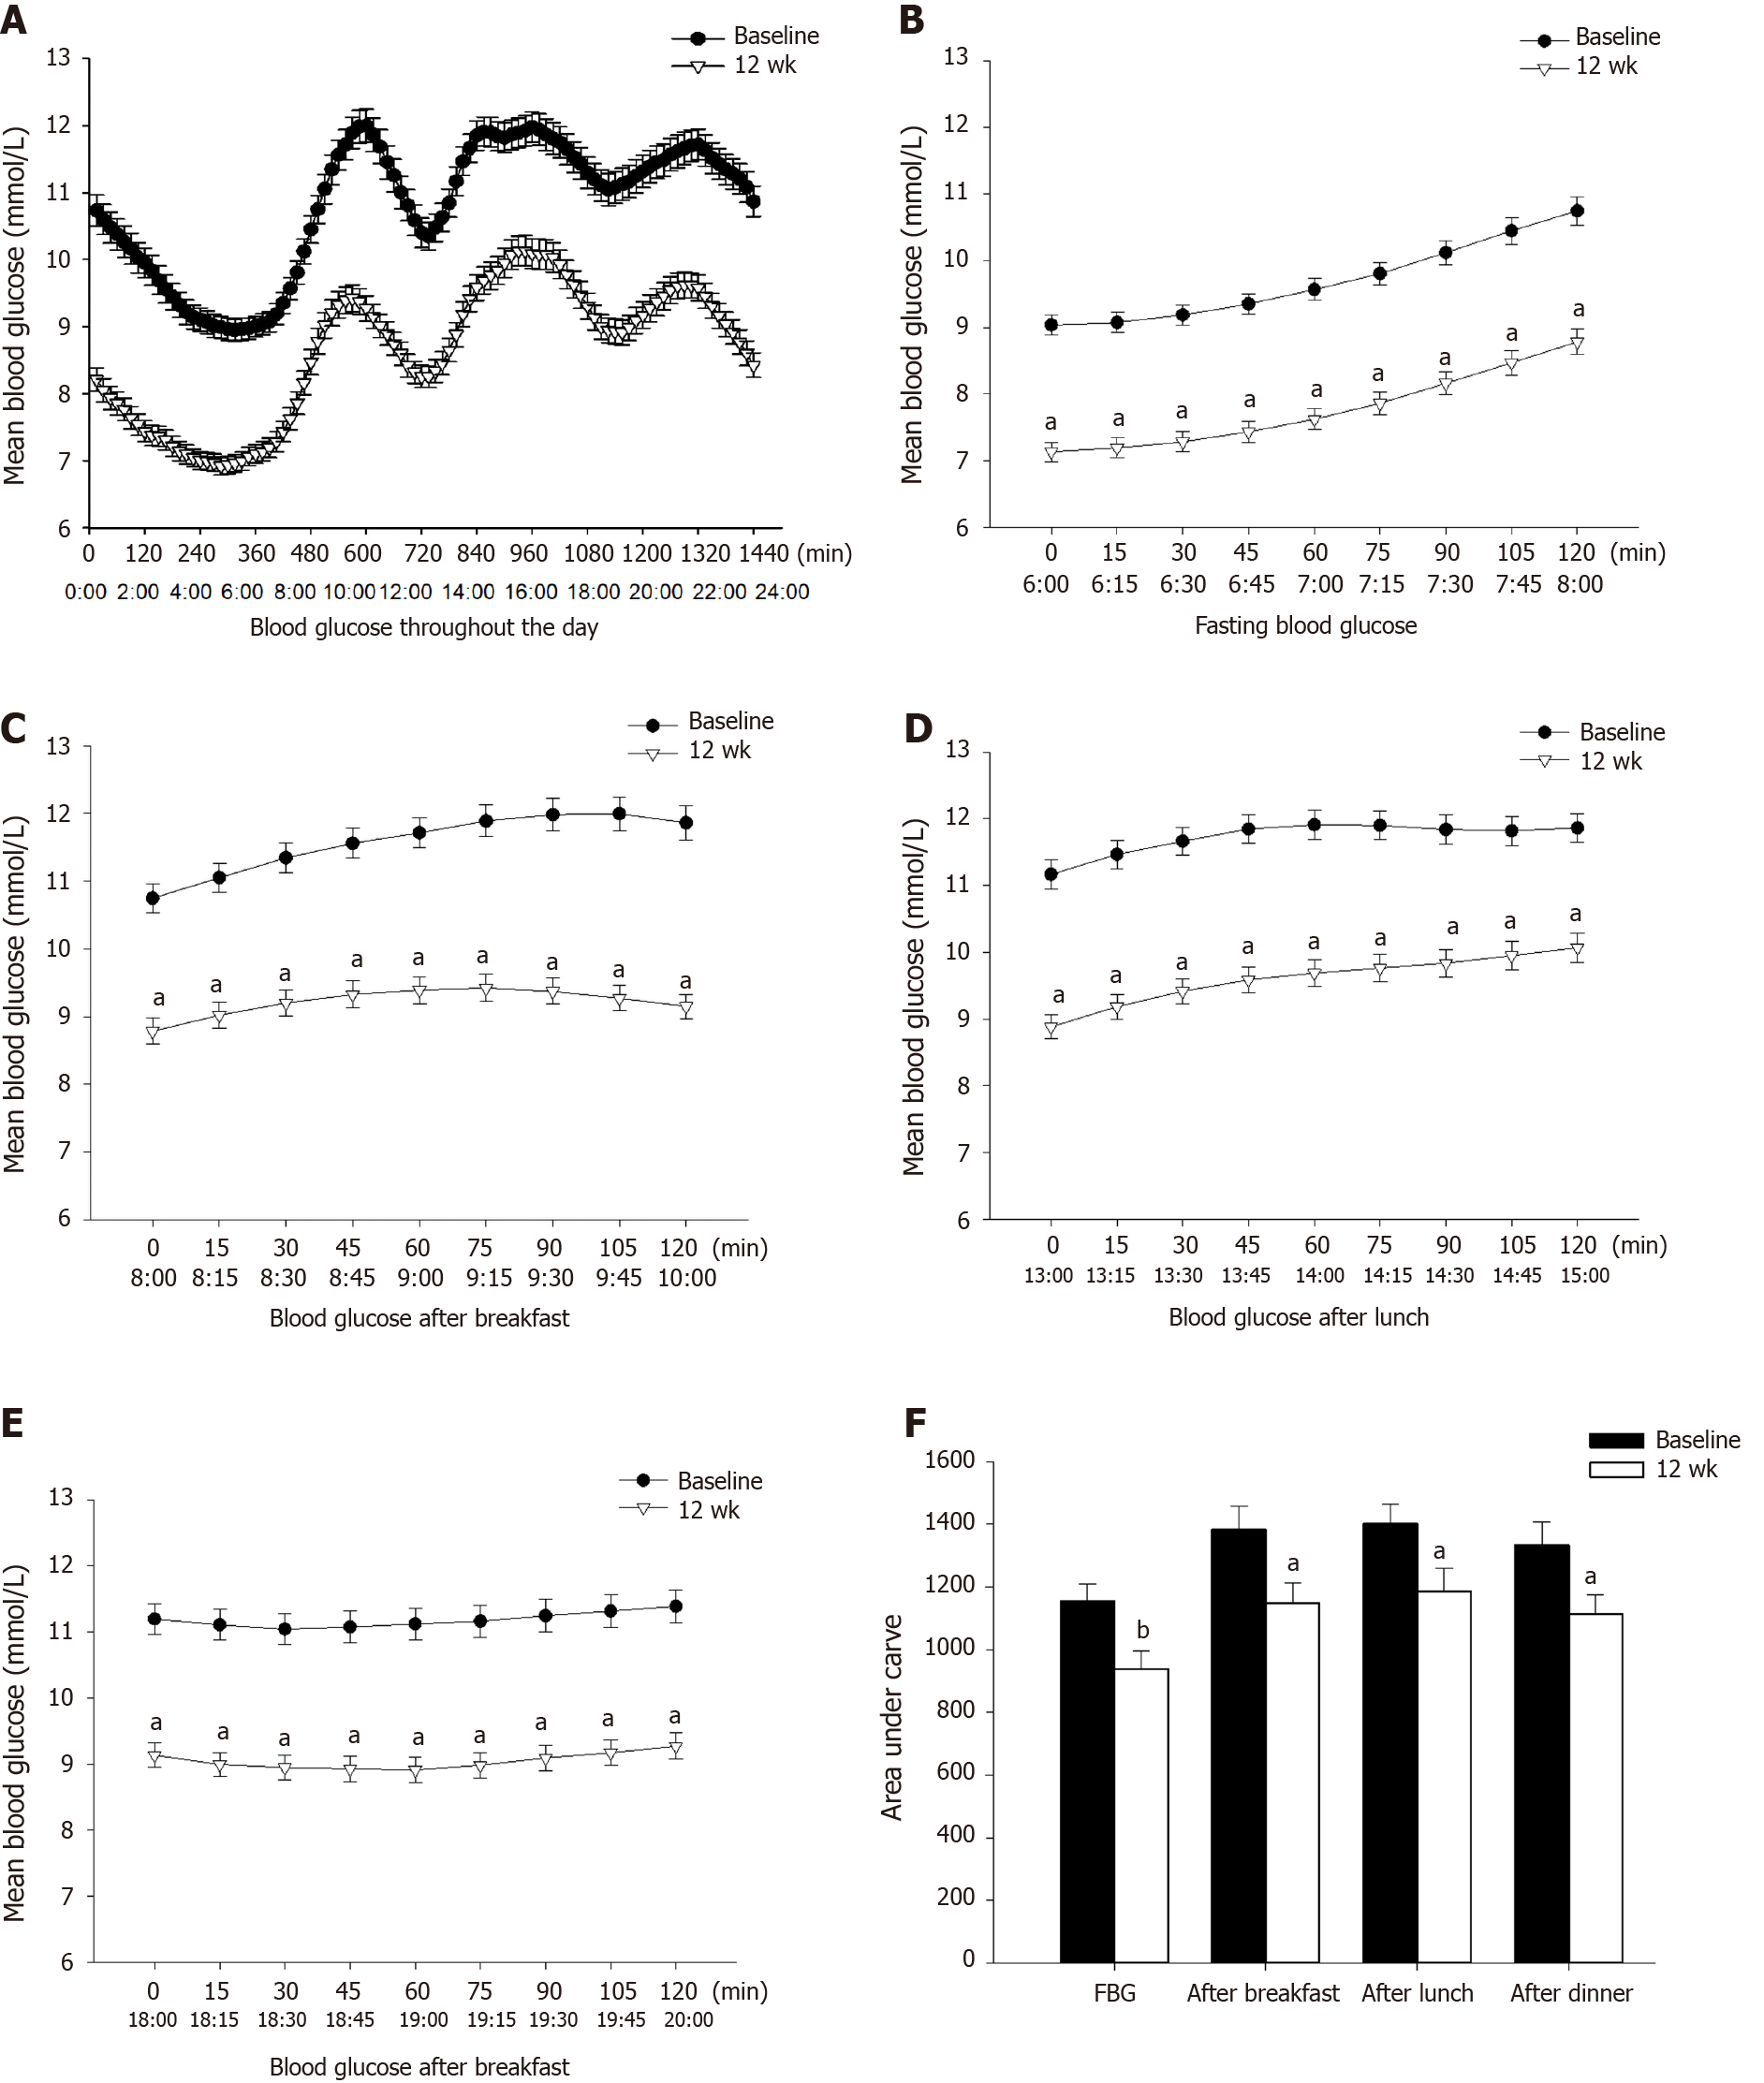
Figure 2 Comparison of mean blood glucose and the area under curves of fasting and postprandial blood glucose at baseline and after treatment.
A: Mean blood glucose from 0:00 to 24:00; B: Mean blood glucose from 6:00 to 8:00; C: Mean blood glucose from 8:00 to 10:00; D: Mean blood glucose from 13:00 to 15:00; E: Mean blood glucose from 18:00 to 20:00; F: Area under the curves of each time period. The data are denoted as mean ± SD. aP < 0.05, bP < 0.01, after 12-wk treatment vs baseline.
- Citation: Li Y, Han MM, He Q, Liu ZA, Liang D, Hou JT, Zhang Y, Liu YF. Exenatide once weekly combined with metformin reduced glycemic variability in type 2 diabetes by using flash glucose monitoring system. World J Diabetes 2020; 11(12): 654-665
- URL: https://www.wjgnet.com/1948-9358/full/v11/i12/654.htm
- DOI: https://dx.doi.org/10.4239/wjd.v11.i12.654


