Copyright
©The Author(s) 2020.
World J Diabetes. Dec 15, 2020; 11(12): 654-665
Published online Dec 15, 2020. doi: 10.4239/wjd.v11.i12.654
Published online Dec 15, 2020. doi: 10.4239/wjd.v11.i12.654
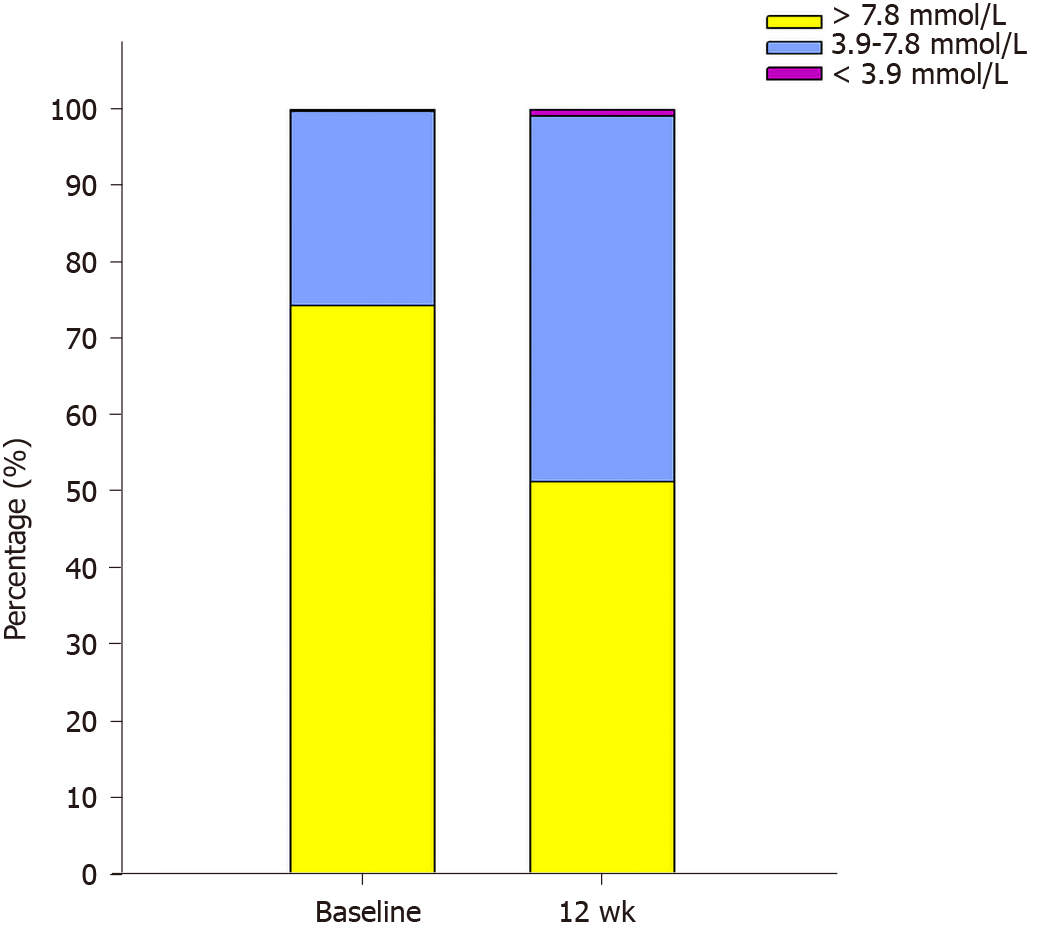
Figure 1 PT1, PT2, and PT3 at baseline and 12 wk.
PT1: Percentage of time below 3.9 mmol/L; PT2: Percentage of time between 3.9-7.8 mmol/L; PT3: Percentage of time above 7.8 mmol/L. P = 0.035, 0.005, and 0.005, respectively, after 12-wk treatment vs baseline.
- Citation: Li Y, Han MM, He Q, Liu ZA, Liang D, Hou JT, Zhang Y, Liu YF. Exenatide once weekly combined with metformin reduced glycemic variability in type 2 diabetes by using flash glucose monitoring system. World J Diabetes 2020; 11(12): 654-665
- URL: https://www.wjgnet.com/1948-9358/full/v11/i12/654.htm
- DOI: https://dx.doi.org/10.4239/wjd.v11.i12.654


