Copyright
©The Author(s) 2020.
World J Diabetes. Nov 15, 2020; 11(11): 501-513
Published online Nov 15, 2020. doi: 10.4239/wjd.v11.i11.501
Published online Nov 15, 2020. doi: 10.4239/wjd.v11.i11.501
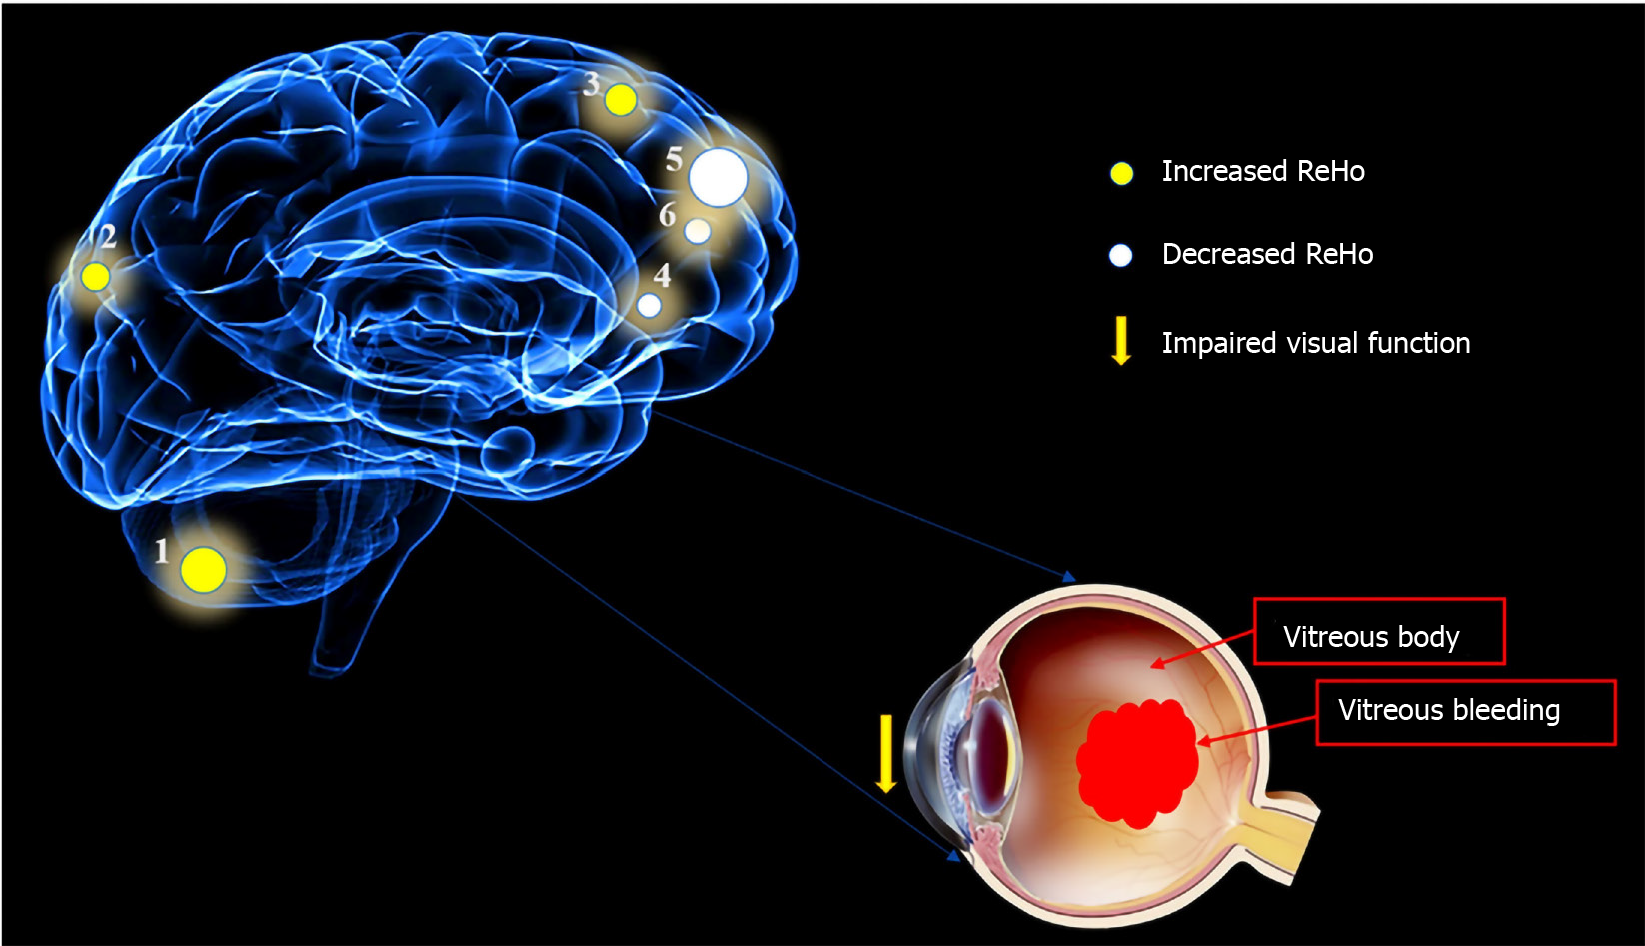
Figure 7 Mean regional homogeneity values of altered brain regions in the diabetic vitreous hemorrhage group.
Compared with the healthy controls, the regional homogeneity values of the following regions were increased to various extents: 1- cerebellum posterior lobe, bilateral (-, t = 5.9833); 2- superior/middle occipital gyrus, right (Brodmann area [BA] 19, t = 4.8595); and 3- superior frontal gyrus, bilateral (BA6, t = 5.0841), whereas the ReHo values of the following regions were decreased: 4- insula, right (BA47, t = -4.1671); 5- medial frontal gyrus, bilateral (BA10, t = -5.0857); and 6- middle frontal gyrus, right (BA9, t = -4.2382). The sizes of the spots denote the degree of quantitative changes. ReHo: Regional homogeneity.
- Citation: Zhang YQ, Zhu FY, Tang LY, Li B, Zhu PW, Shi WQ, Lin Q, Min YL, Shao Y, Zhou Q. Altered regional homogeneity in patients with diabetic vitreous hemorrhage. World J Diabetes 2020; 11(11): 501-513
- URL: https://www.wjgnet.com/1948-9358/full/v11/i11/501.htm
- DOI: https://dx.doi.org/10.4239/wjd.v11.i11.501


