Copyright
©The Author(s) 2020.
World J Diabetes. Nov 15, 2020; 11(11): 501-513
Published online Nov 15, 2020. doi: 10.4239/wjd.v11.i11.501
Published online Nov 15, 2020. doi: 10.4239/wjd.v11.i11.501
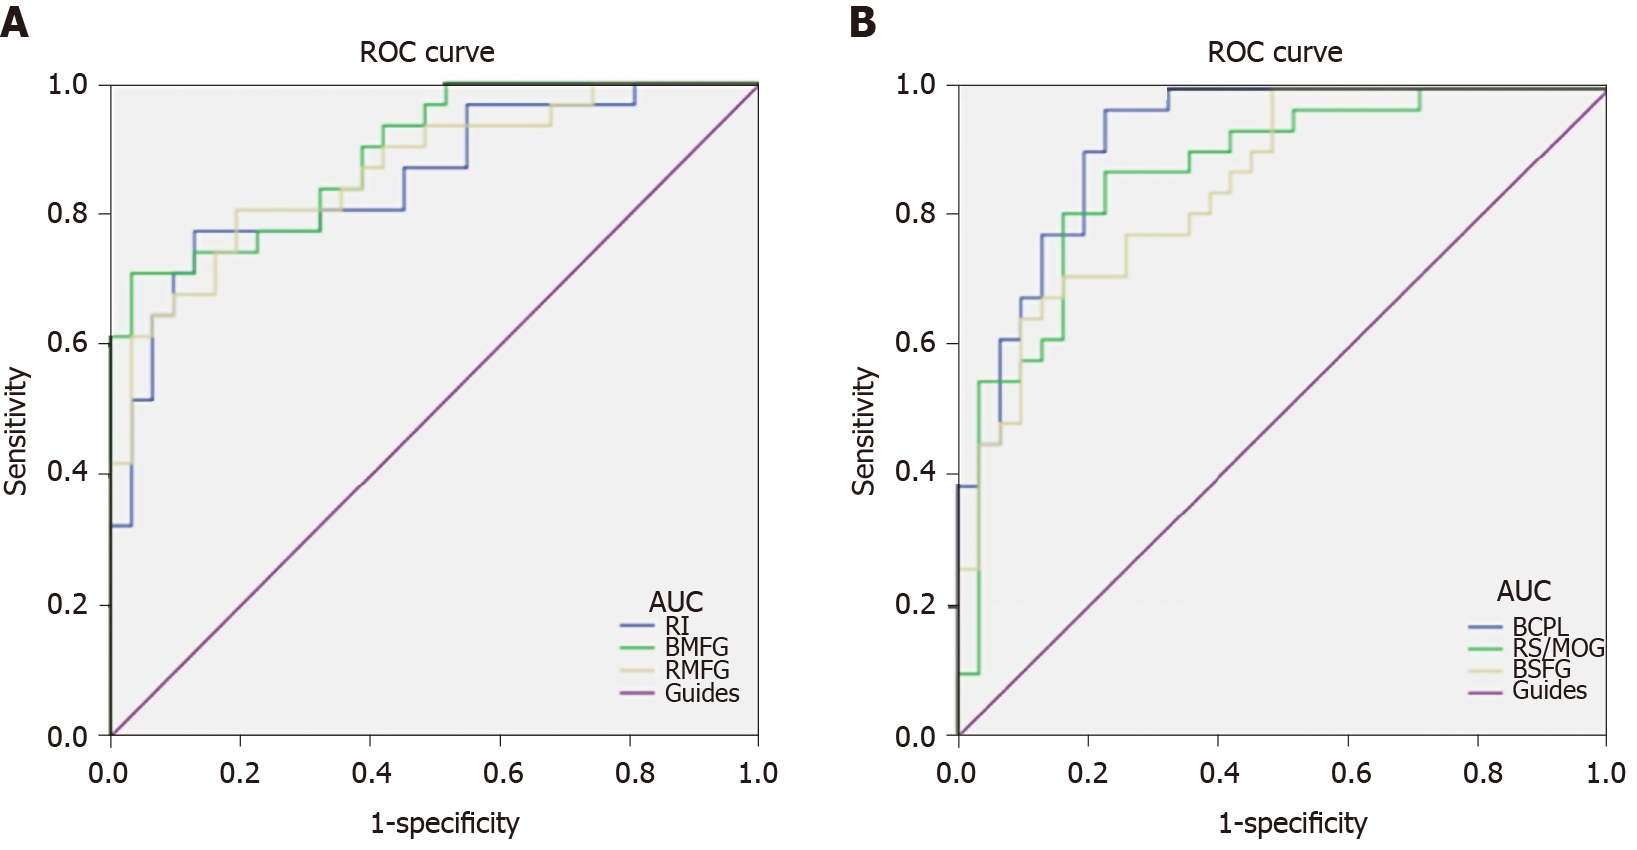
Figure 5 Receiver operating characteristic curve analysis of mean regional homogeneity values for altered brain regions.
A: The areas under the receiver operating characteristic (ROC) curves were 0.919 [P < 0.001; 95% confidence interval (CI): 0.852-0.986] for bilateral cerebellum posterior lobe, 0.868 (P < 0.001; 95%CI: 0.777-0.959) for the right superior/middle occipital gyrus, and 0.851 (P < 0.001; 95%CI: 0.759-0.943) for bilateral superior frontal gyrus; B: The areas under the ROC curves were 0.852 (P < 0.001; 95%CI: 0.757-0.947) for the right insula, 0.894 (P < 0.001; 95%CI: 0.818-0.970) for bilateral medial frontal gyrus, and 0.867 (P < 0.001; 95%CI: 0.778-0.955) for right middle frontal gyrus. ROC: Receiver operating characteristic; AUC: Area under the curve; RI: Right insula; BMFG: Bilateral medial frontal gyrus; RMFG: Right middle frontal gyrus; BCPL: Bilateral cerebellum posterior lobe; RS: Right superior; MOG: Middle occipital gyrus; BSFG: Bilateral superior frontal gyrus.
- Citation: Zhang YQ, Zhu FY, Tang LY, Li B, Zhu PW, Shi WQ, Lin Q, Min YL, Shao Y, Zhou Q. Altered regional homogeneity in patients with diabetic vitreous hemorrhage. World J Diabetes 2020; 11(11): 501-513
- URL: https://www.wjgnet.com/1948-9358/full/v11/i11/501.htm
- DOI: https://dx.doi.org/10.4239/wjd.v11.i11.501


