Copyright
©2010 Baishideng.
World J Diabetes. May 15, 2010; 1(2): 57-64
Published online May 15, 2010. doi: 10.4239/wjd.v1.i2.57
Published online May 15, 2010. doi: 10.4239/wjd.v1.i2.57
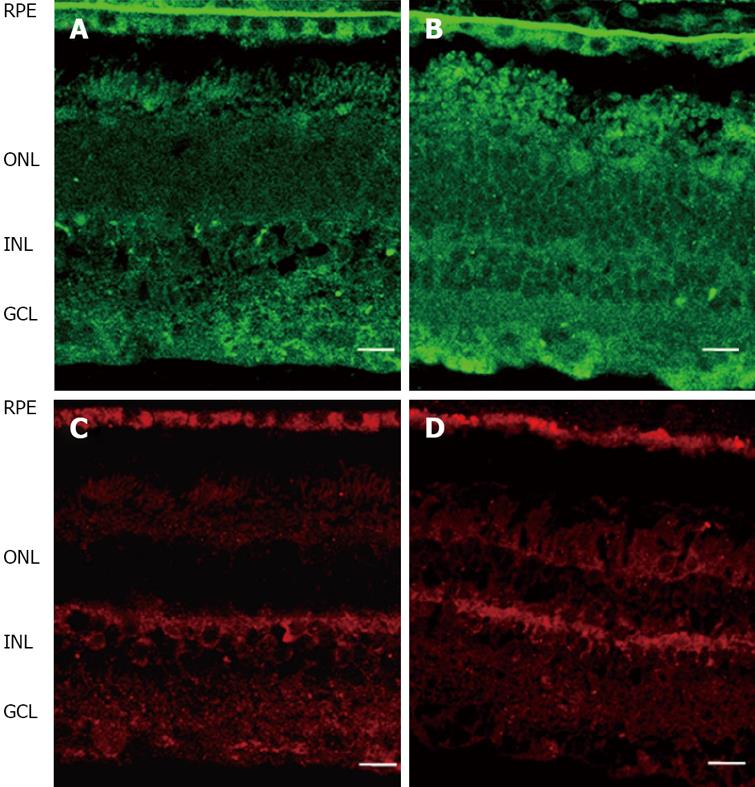
Figure 4 Comparison of Epo (upper pannel, green) and EpoR (lower pannel, red) immunofluorescence in the human retina between representative samples.
A, C: Non-diabetic donor; B, D: Diabetic donor. RPE: Retinal pigment epithelium; ONL: Outer nuclear layer; INL: Inner nuclear layer; GCL: Ganglion cell layer. The bar represents 20 mm.
- Citation: Villarroel M, Ciudin A, Hernández C, Simó R. Neurodegeneration: An early event of diabetic retinopathy. World J Diabetes 2010; 1(2): 57-64
- URL: https://www.wjgnet.com/1948-9358/full/v1/i2/57.htm
- DOI: https://dx.doi.org/10.4239/wjd.v1.i2.57


