Copyright
©The Author(s) 2015.
World J Diabetes. Sep 25, 2015; 6(12): 1207-1222
Published online Sep 25, 2015. doi: 10.4239/wjd.v6.i12.1207
Published online Sep 25, 2015. doi: 10.4239/wjd.v6.i12.1207
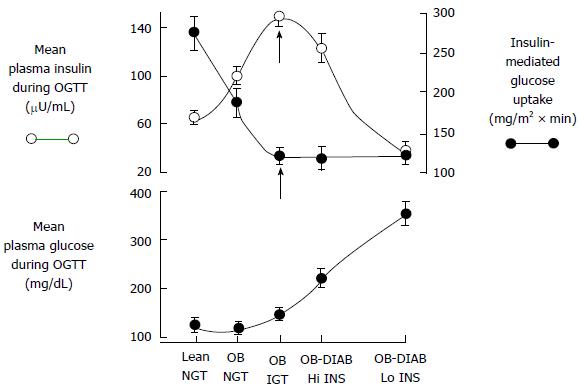
Figure 1 Natural history of type 2 diabetes mellitus.
The plasma insulin response (open circles) depicts the classic Starling’s curve of the pancreas. Closed circles = insulin-mediated glucose uptake (top panel). DIAB: Diabetes; Hi INS: High insulin secretion; IGT: Impaired glucose tolerance; Lo INS: Low insulin secretion; NGT: Normal glucose tolerance; OB: Obese; OGTT: Oral glucose tolerance test.
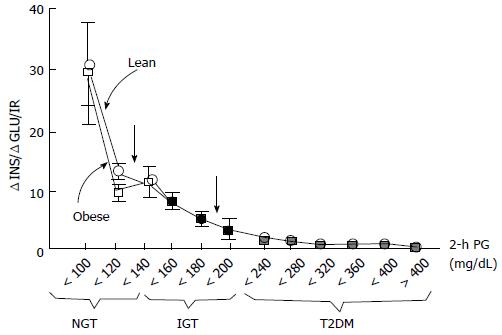
Figure 2 Insulin secretion/insulin resistance (disposition) index (defined as change in insulin/change in glucose/insulin resistance) in individuals with normal glucose tolerance, impaired glucose tolerance, and type 2 diabetes mellitus as a function of the 2-h plasma glucose concentration in lean (closed circles) and obese (open circles) subjects.
IGT: Impaired glucose tolerance; NGT: Normal glucose tolerance; T2DM: Type 2 diabetes mellitus; PG: Plasma glucose; ΔINS/ΔGLU/IR: Change in insulin/change in glucose ÷ insulin resistance.
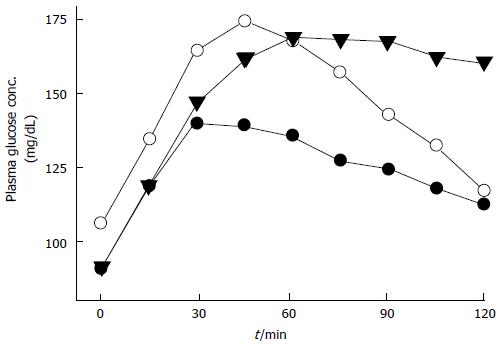
Figure 3 Plasma glucose concentration during the oral glucose tolerance test in normal glucose tolerant (close circles) individuals and in subjects with impaired glucose tolerance (closed triangles) and impaired fasting glucose (open circles).
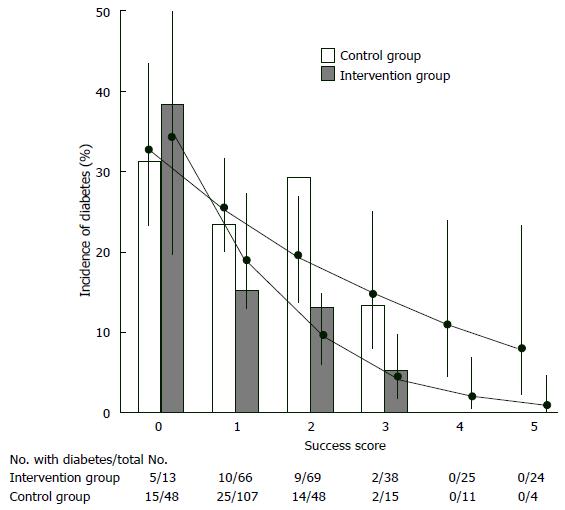
Figure 4 Incidence of diabetes during follow-up, according to the success score.
At the one-year visit, each subject received grade of 0 for each intervention goal that had not been achieved and a grade 1 for each goal that had been achieved; the success score was computed as the sum of the grades (reproduced from J Tuomilehto and J Lindström).
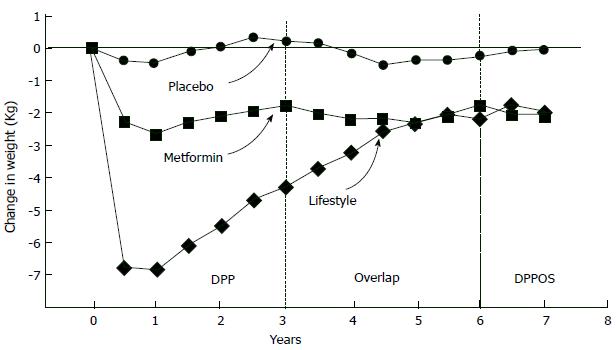
Figure 5 Change in body weight during the dipeptidyl peptidase, during the overlap period, and during the Dipeptidyl peptidase Outcomes Study (reproduced from Eriksson and Lindgärde).
DPP: Dipeptidyl peptidase; DPPOS: Dipeptidyl peptidase Outcomes Study.
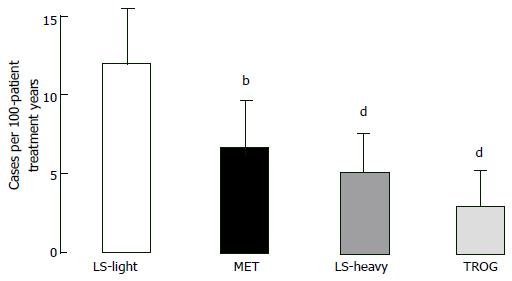
Figure 6 Effect of lifestyle intervention, metformin, and troglitazone on the conversion rate of ımpaired glucose tolerance to type 2 diabetes in the first 1.
5 years of the dipeptidyl peptidase (i.e, before the discontinuation of troglitazone from the dipeptidyl peptidase). bP < 0.01 vs LS-light, dP < 0.01 vs LS-heavy. LS: Lifestyle; MET: Metformin; TROG: Troglitazone.
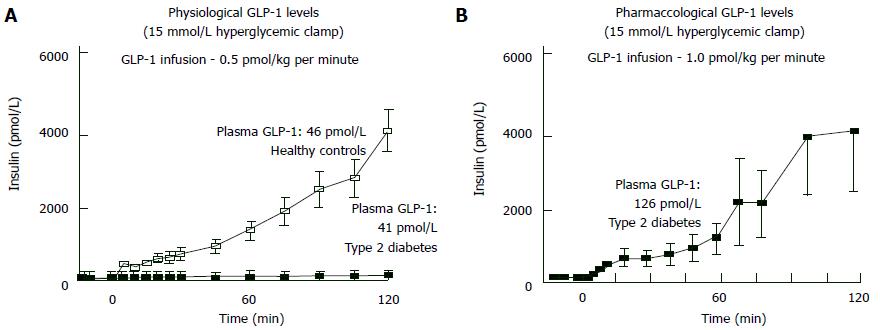
Figure 7 Effect of physiologic (A) and pharmacologic (B) doses of glucagon-like peptide-1 on insulin secretion in normal glucose tolerance individuals and in subjects with type 2 diabetes mellitus.
GLP-1: Glucagon-like peptide-1.
- Citation: Kanat M, DeFronzo RA, Abdul-Ghani MA. Treatment of prediabetes. World J Diabetes 2015; 6(12): 1207-1222
- URL: https://www.wjgnet.com/1948-9358/full/v6/i12/1207.htm
- DOI: https://dx.doi.org/10.4239/wjd.v6.i12.1207


