Copyright
©The Author(s) 2023.
World J Diabetes. Sep 15, 2023; 14(9): 1385-1392
Published online Sep 15, 2023. doi: 10.4239/wjd.v14.i9.1385
Published online Sep 15, 2023. doi: 10.4239/wjd.v14.i9.1385
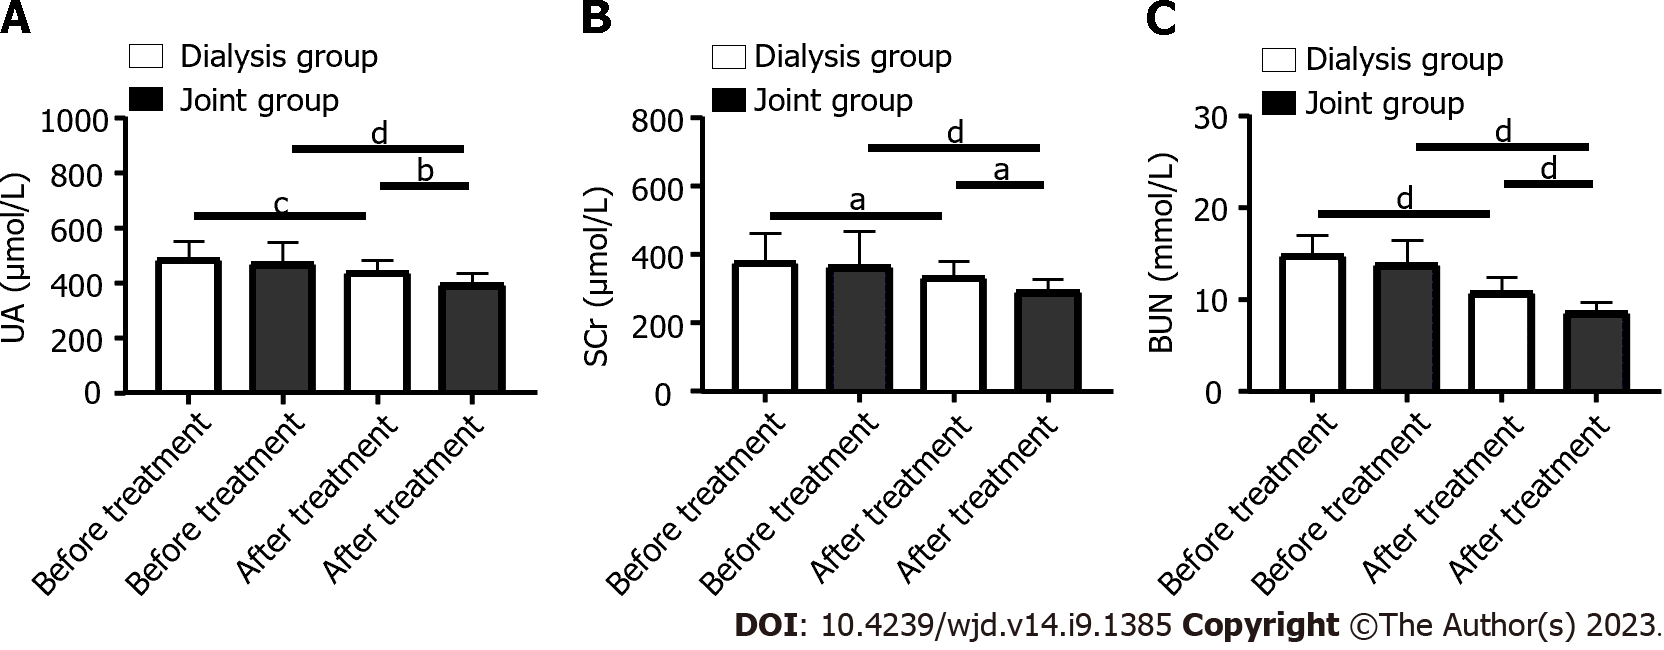
Figure 1 Changes in renal-function-related indexes in the patients before and after treatment.
A: Comparison of uric acid changes in the two groups before and after treatment; B: Comparison of serum creatinine changes in the two groups before and after treatment; C: Comparison of blood urea nitrogen changes in the two groups before and after treatment. aP < 0.05, bP < 0.01 cP < 0.001, dP < 0.0001. SCr: Serum creatinine; UA: Uric acid; BUN: Blood urea nitrogen.
Figure 2 Changes in bone-metabolism-related indexes in patients before and after treatment.
A: Comparison of phosphorus changes before and after treatment; B: Comparison of calcium changes before and after treatment; C: Comparison of procollagen type I amino-terminal propeptide changes before and after treatment; D: Comparison of intact Paricalcitol hormone changes before and after treatment. aP < 0.05, bP < 0.01, cP < 0.001, dP < 0.0001. PINP: Procollagen type I amino-terminal propeptide; iPTH: intact Paricalcitol hormone.
Figure 3 Least absolute shrinkage and selection operator-based screening of predictors.
A, B: The coefficient distribution of the least absolute shrinkage and selection operator repression analysis and the calculation of adjustment parameters (lambda) based on partial likelihood deviation of 10 times cross-validation.
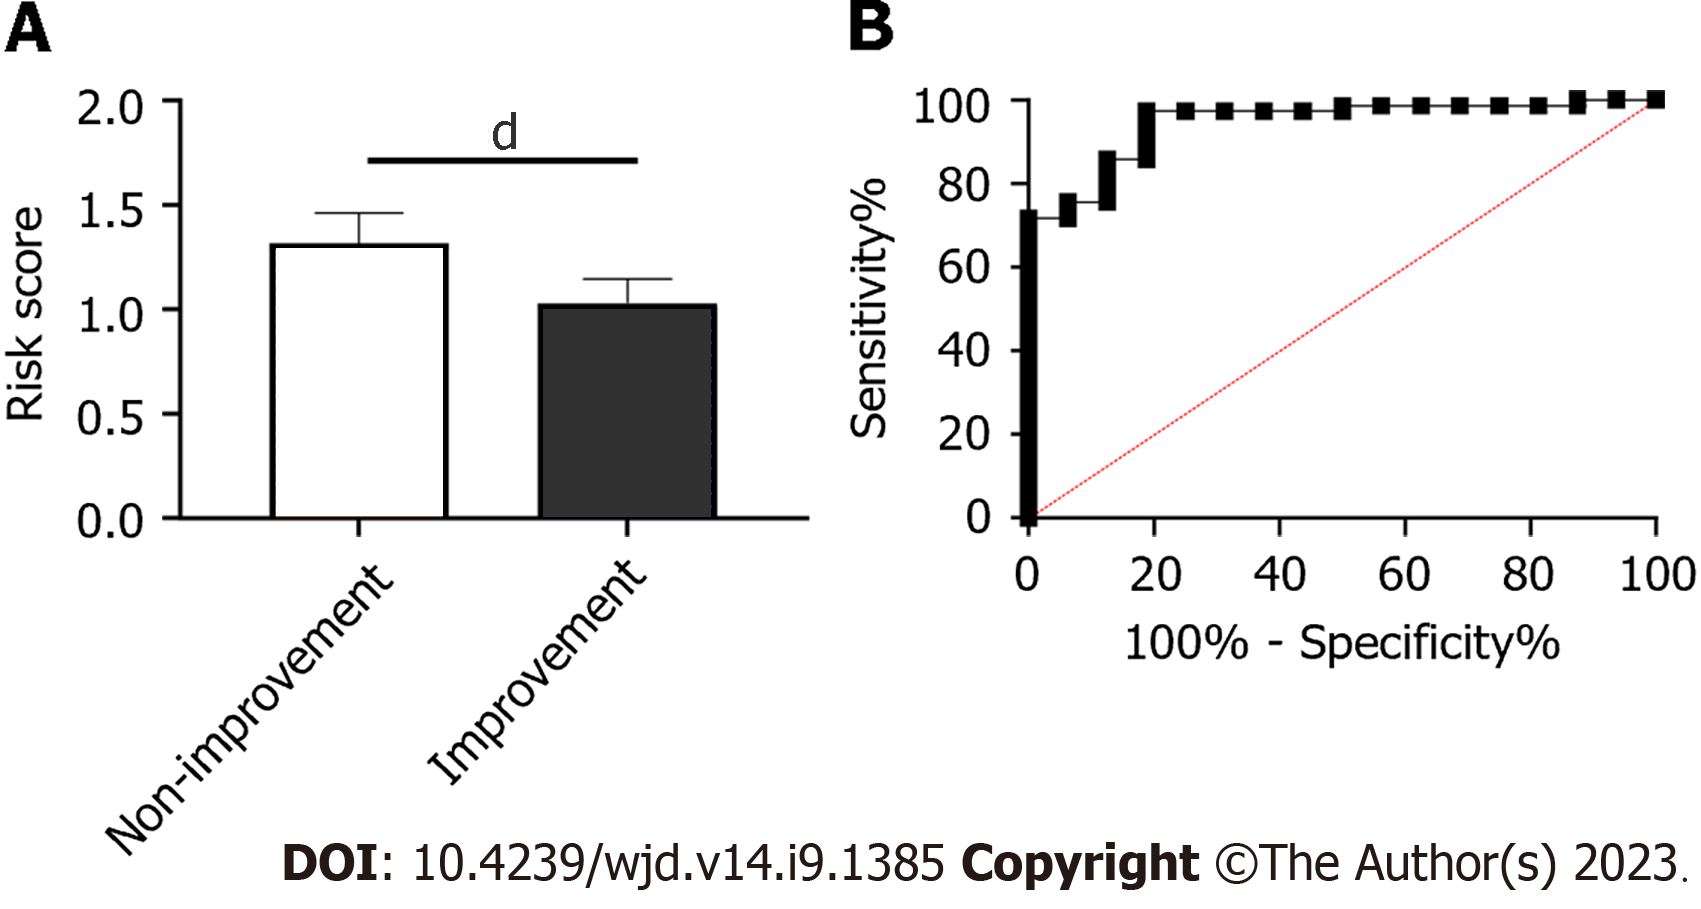
Figure 4 Risk score in patients with different efficacy.
A: Risk score in the non-improvement group and improvement group; B: Receiver operating characteristic curve of risk score in predicting efficacy. dP < 0.0001.
- Citation: Ma XY, Sheng YP, Yang XM, Zhang HR, Sun FY. Effects of paricalcitol combined with hemodiafiltration on bone-metabolism-related indexes in patients with diabetic nephropathy and chronic renal failure. World J Diabetes 2023; 14(9): 1385-1392
- URL: https://www.wjgnet.com/1948-9358/full/v14/i9/1385.htm
- DOI: https://dx.doi.org/10.4239/wjd.v14.i9.1385


