Copyright
©The Author(s) 2023.
World J Diabetes. Sep 15, 2023; 14(9): 1369-1384
Published online Sep 15, 2023. doi: 10.4239/wjd.v14.i9.1369
Published online Sep 15, 2023. doi: 10.4239/wjd.v14.i9.1369
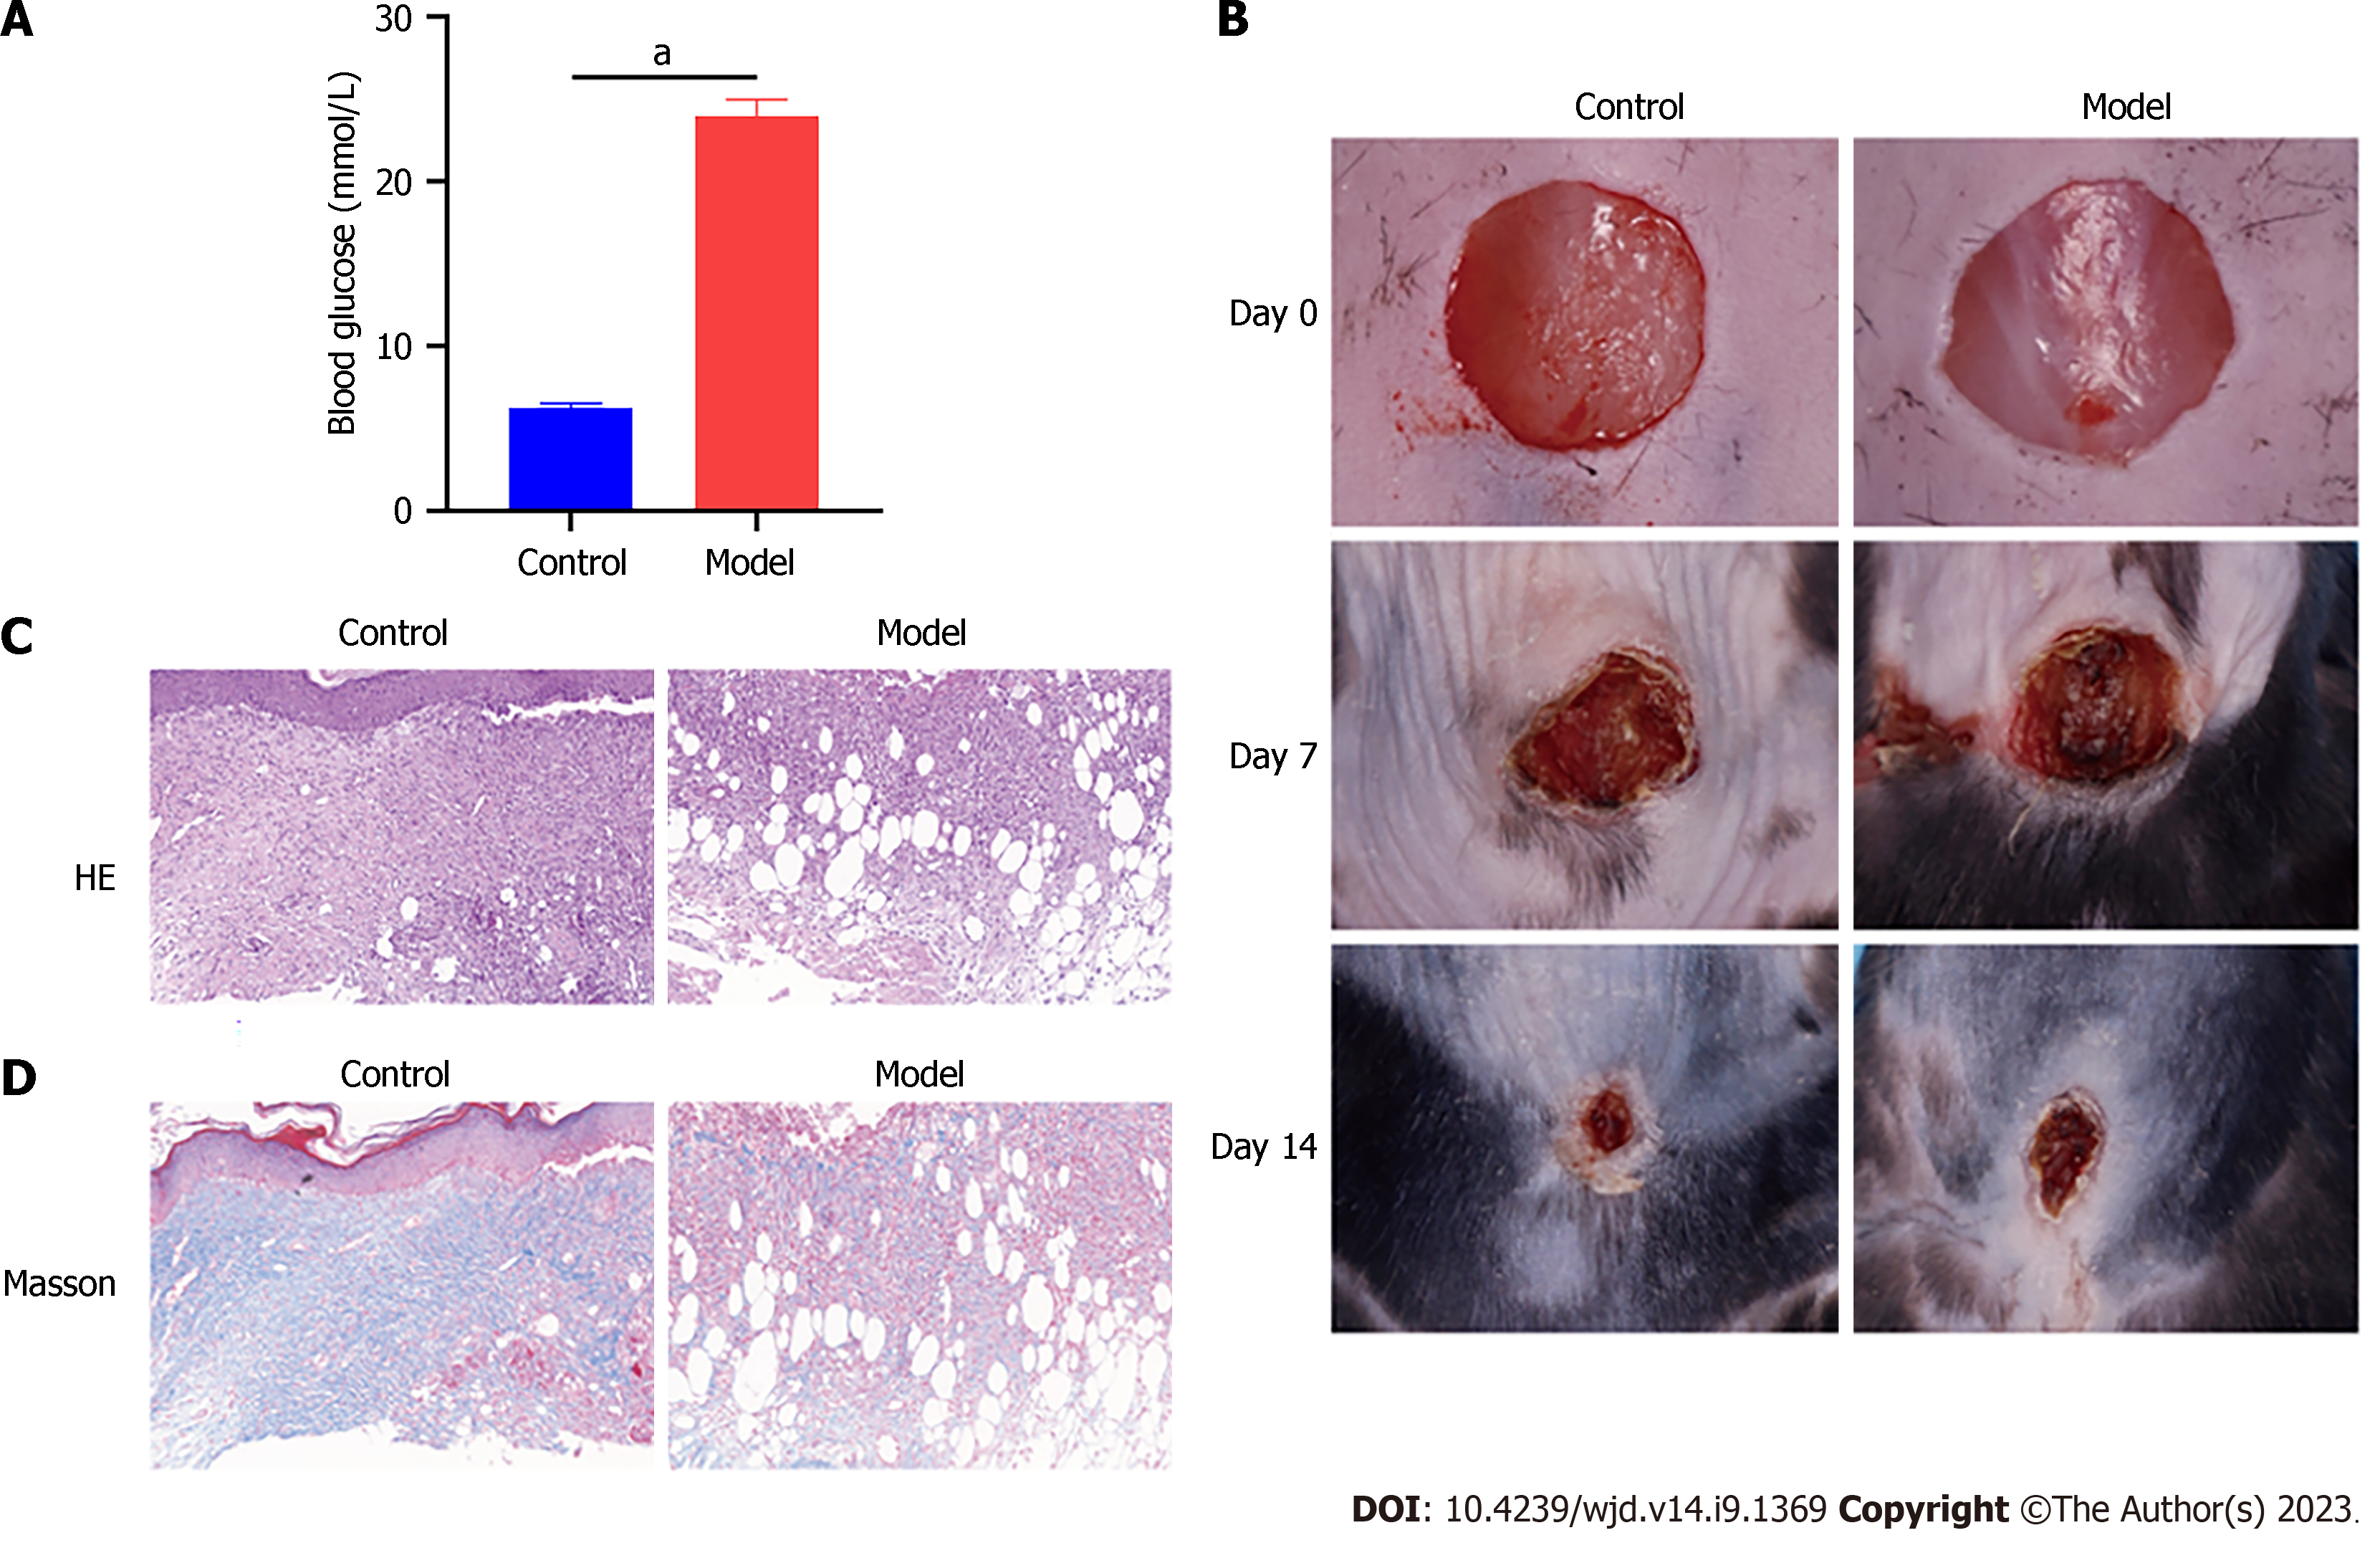
Figure 1 Establishment of diabetic model using streptozotocin.
A: The blood glucose level of mice, control (n = 10) and model (n = 10); B: Representative skin wound images from control and model mice at day 0 d, 7 d, and 14 d; C and D: HE and Masson staining of skin wound in each group. aP < 0.0001, compared to the control group.
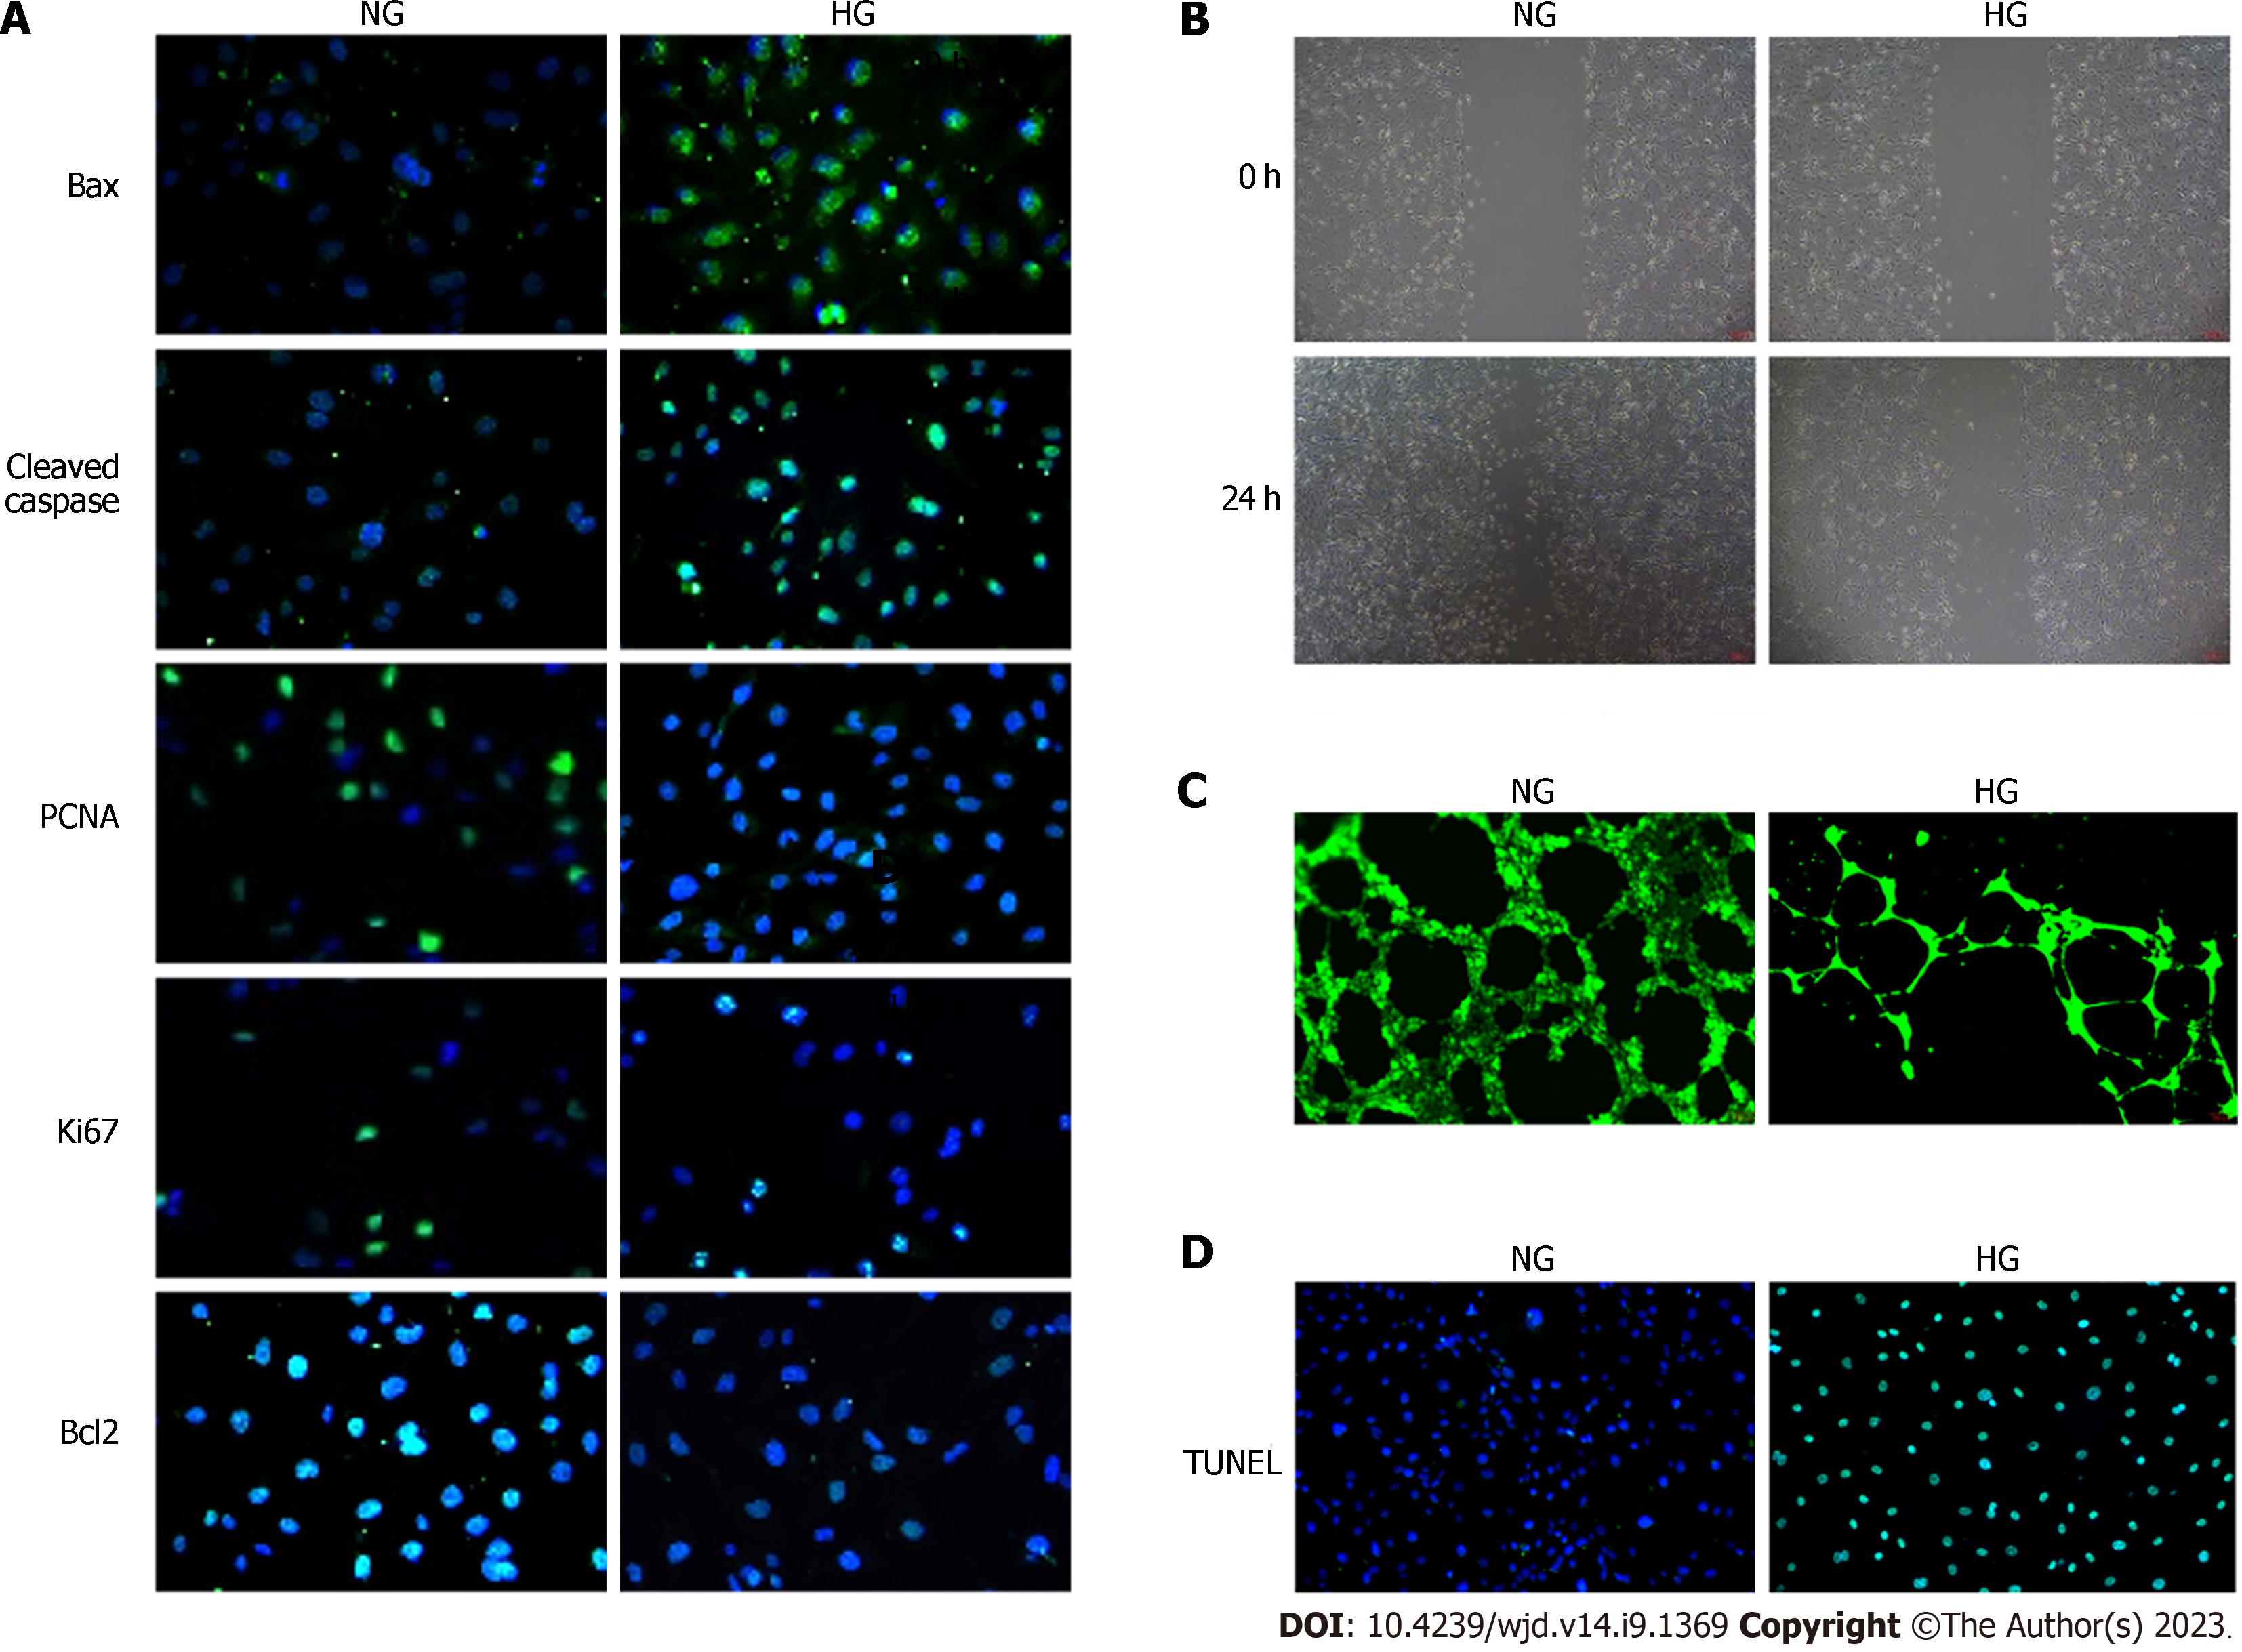
Figure 2 High glucose inhibited proliferation and tubule formation of human umbilical vein endothelial cells.
A: Immunofluorescence staining of Bax, cleaved caspase-3, PCNA, Ki67, and Bcl2 in human umbilical vein endothelial cells (HUVECs); B: Wound healing assay in HUVECs, scale bars = 200 μm; C: Capillary-like tubule formation, scale bars = 200 μm; D: Transferase-mediated dUTP nick end labeling assay.
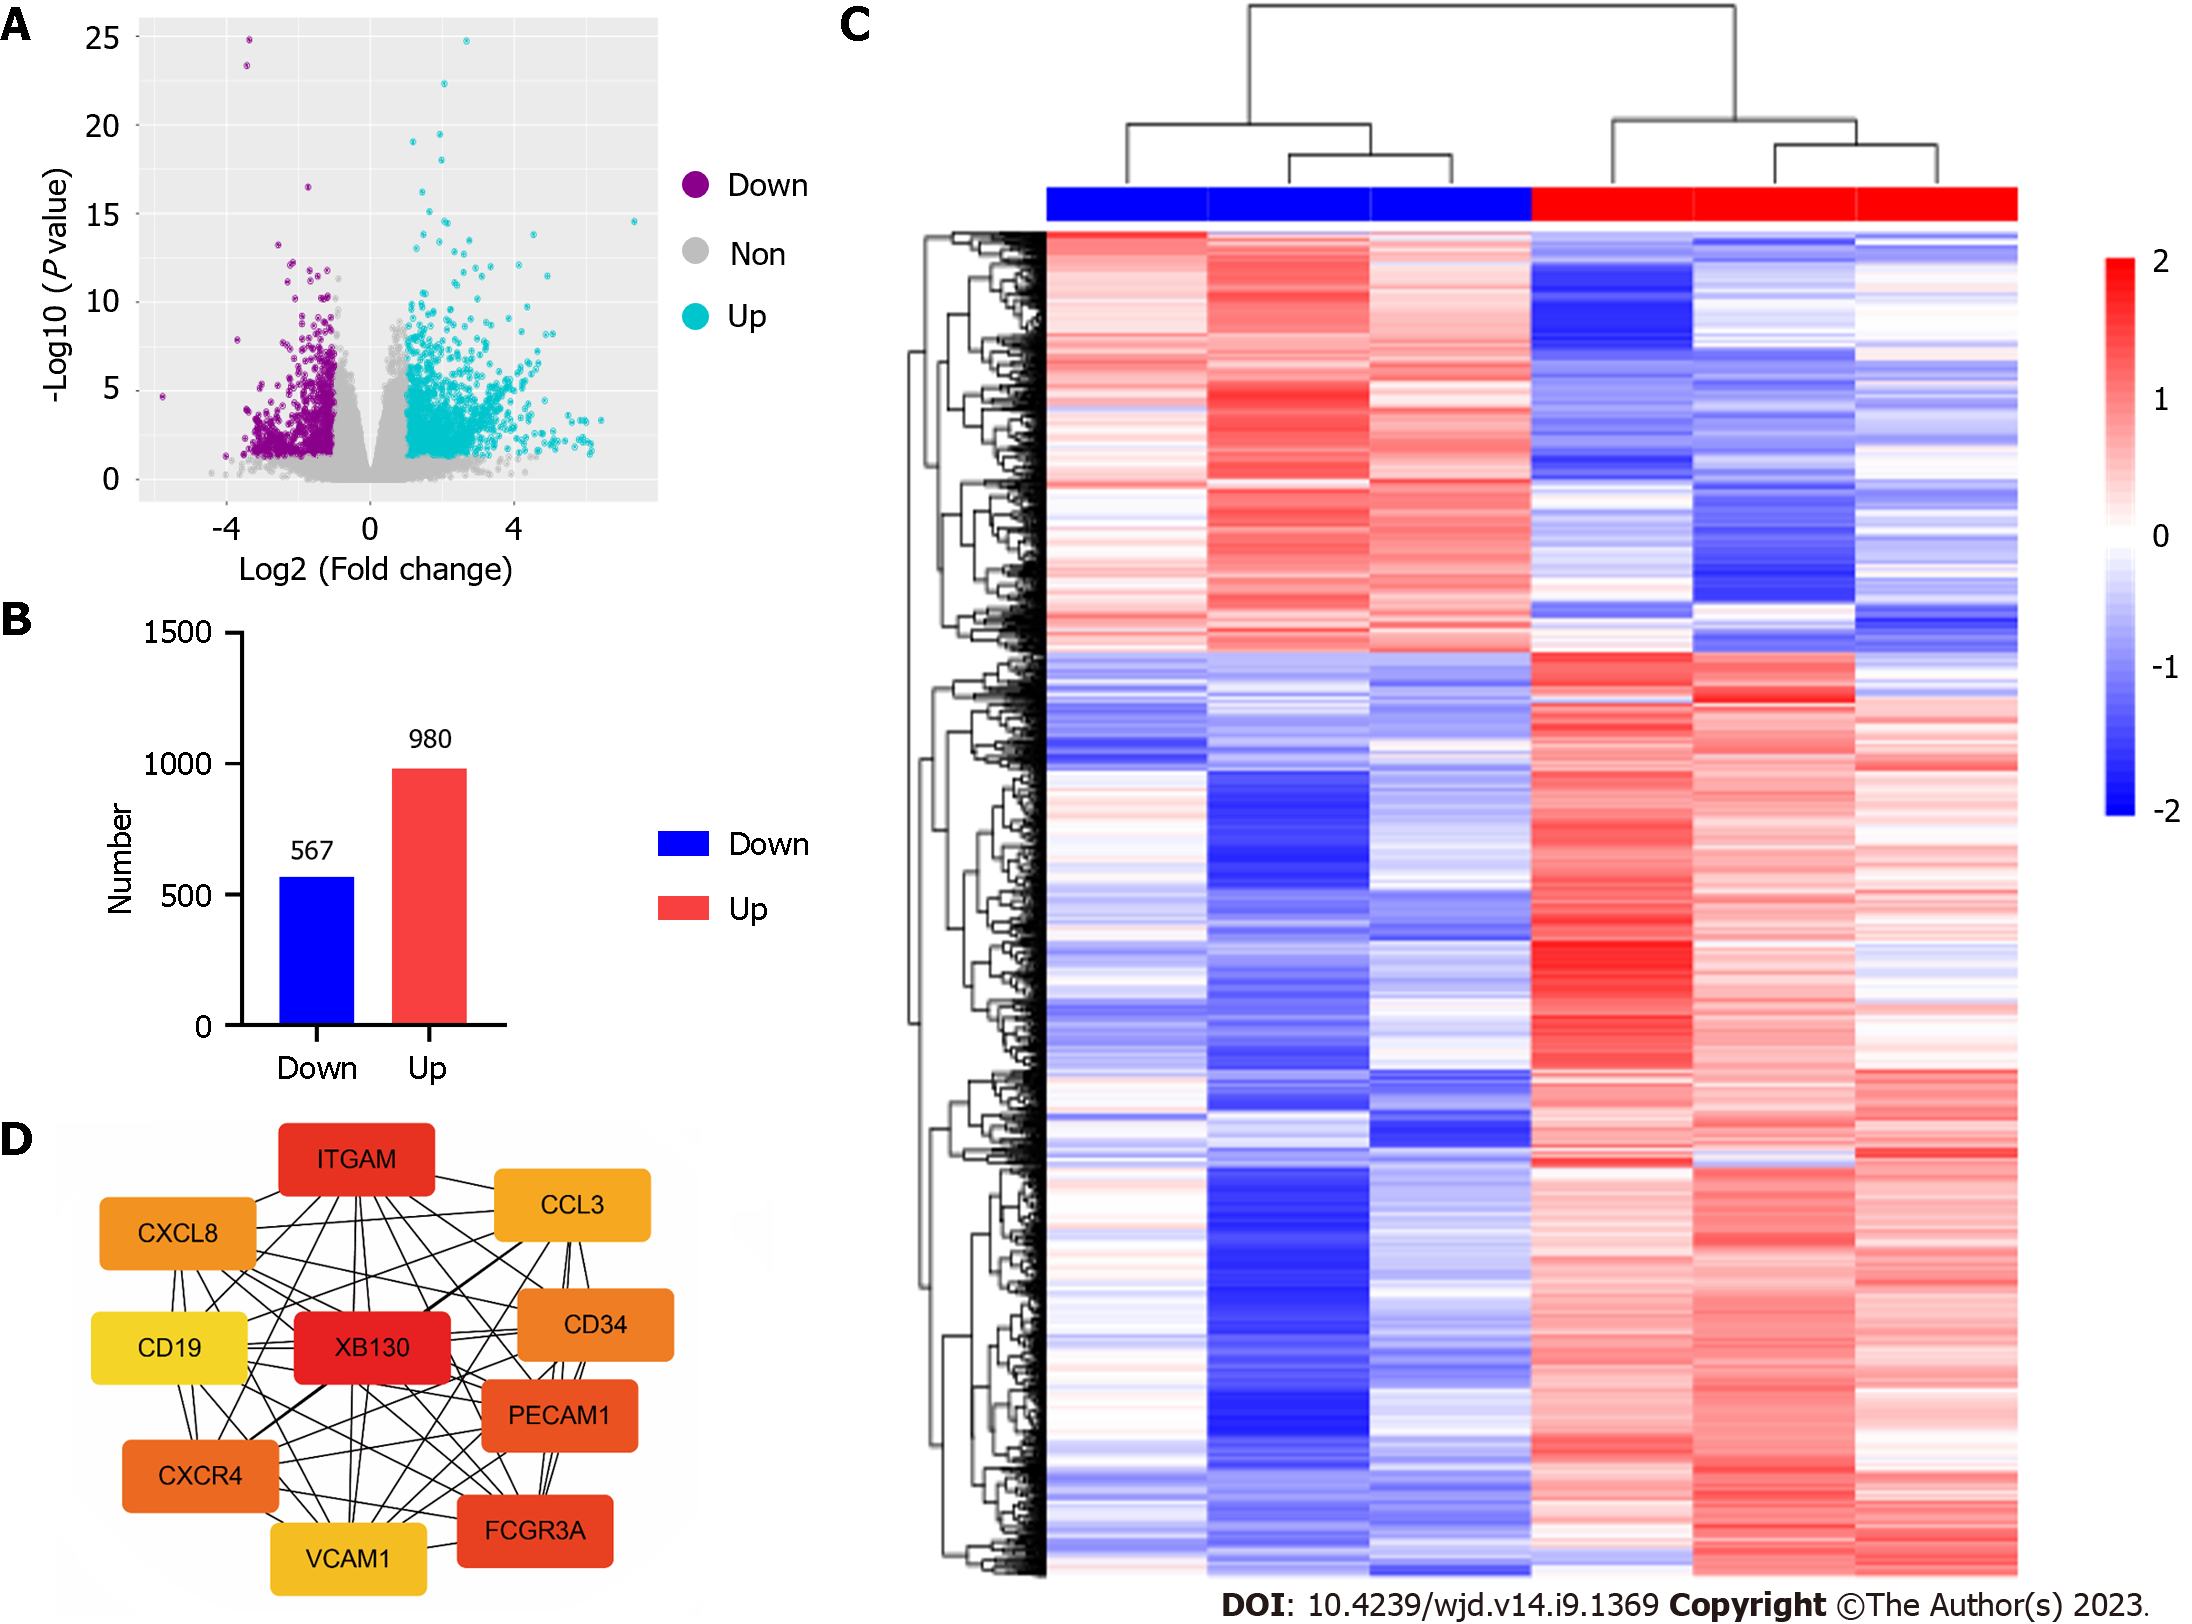
Figure 3 Differential expression genes identification and hub genes identification.
A: Volcano plot; B: Histogram; C: Heatmap; D: Top 10 hub genes obtained from protein-protein interaction network.
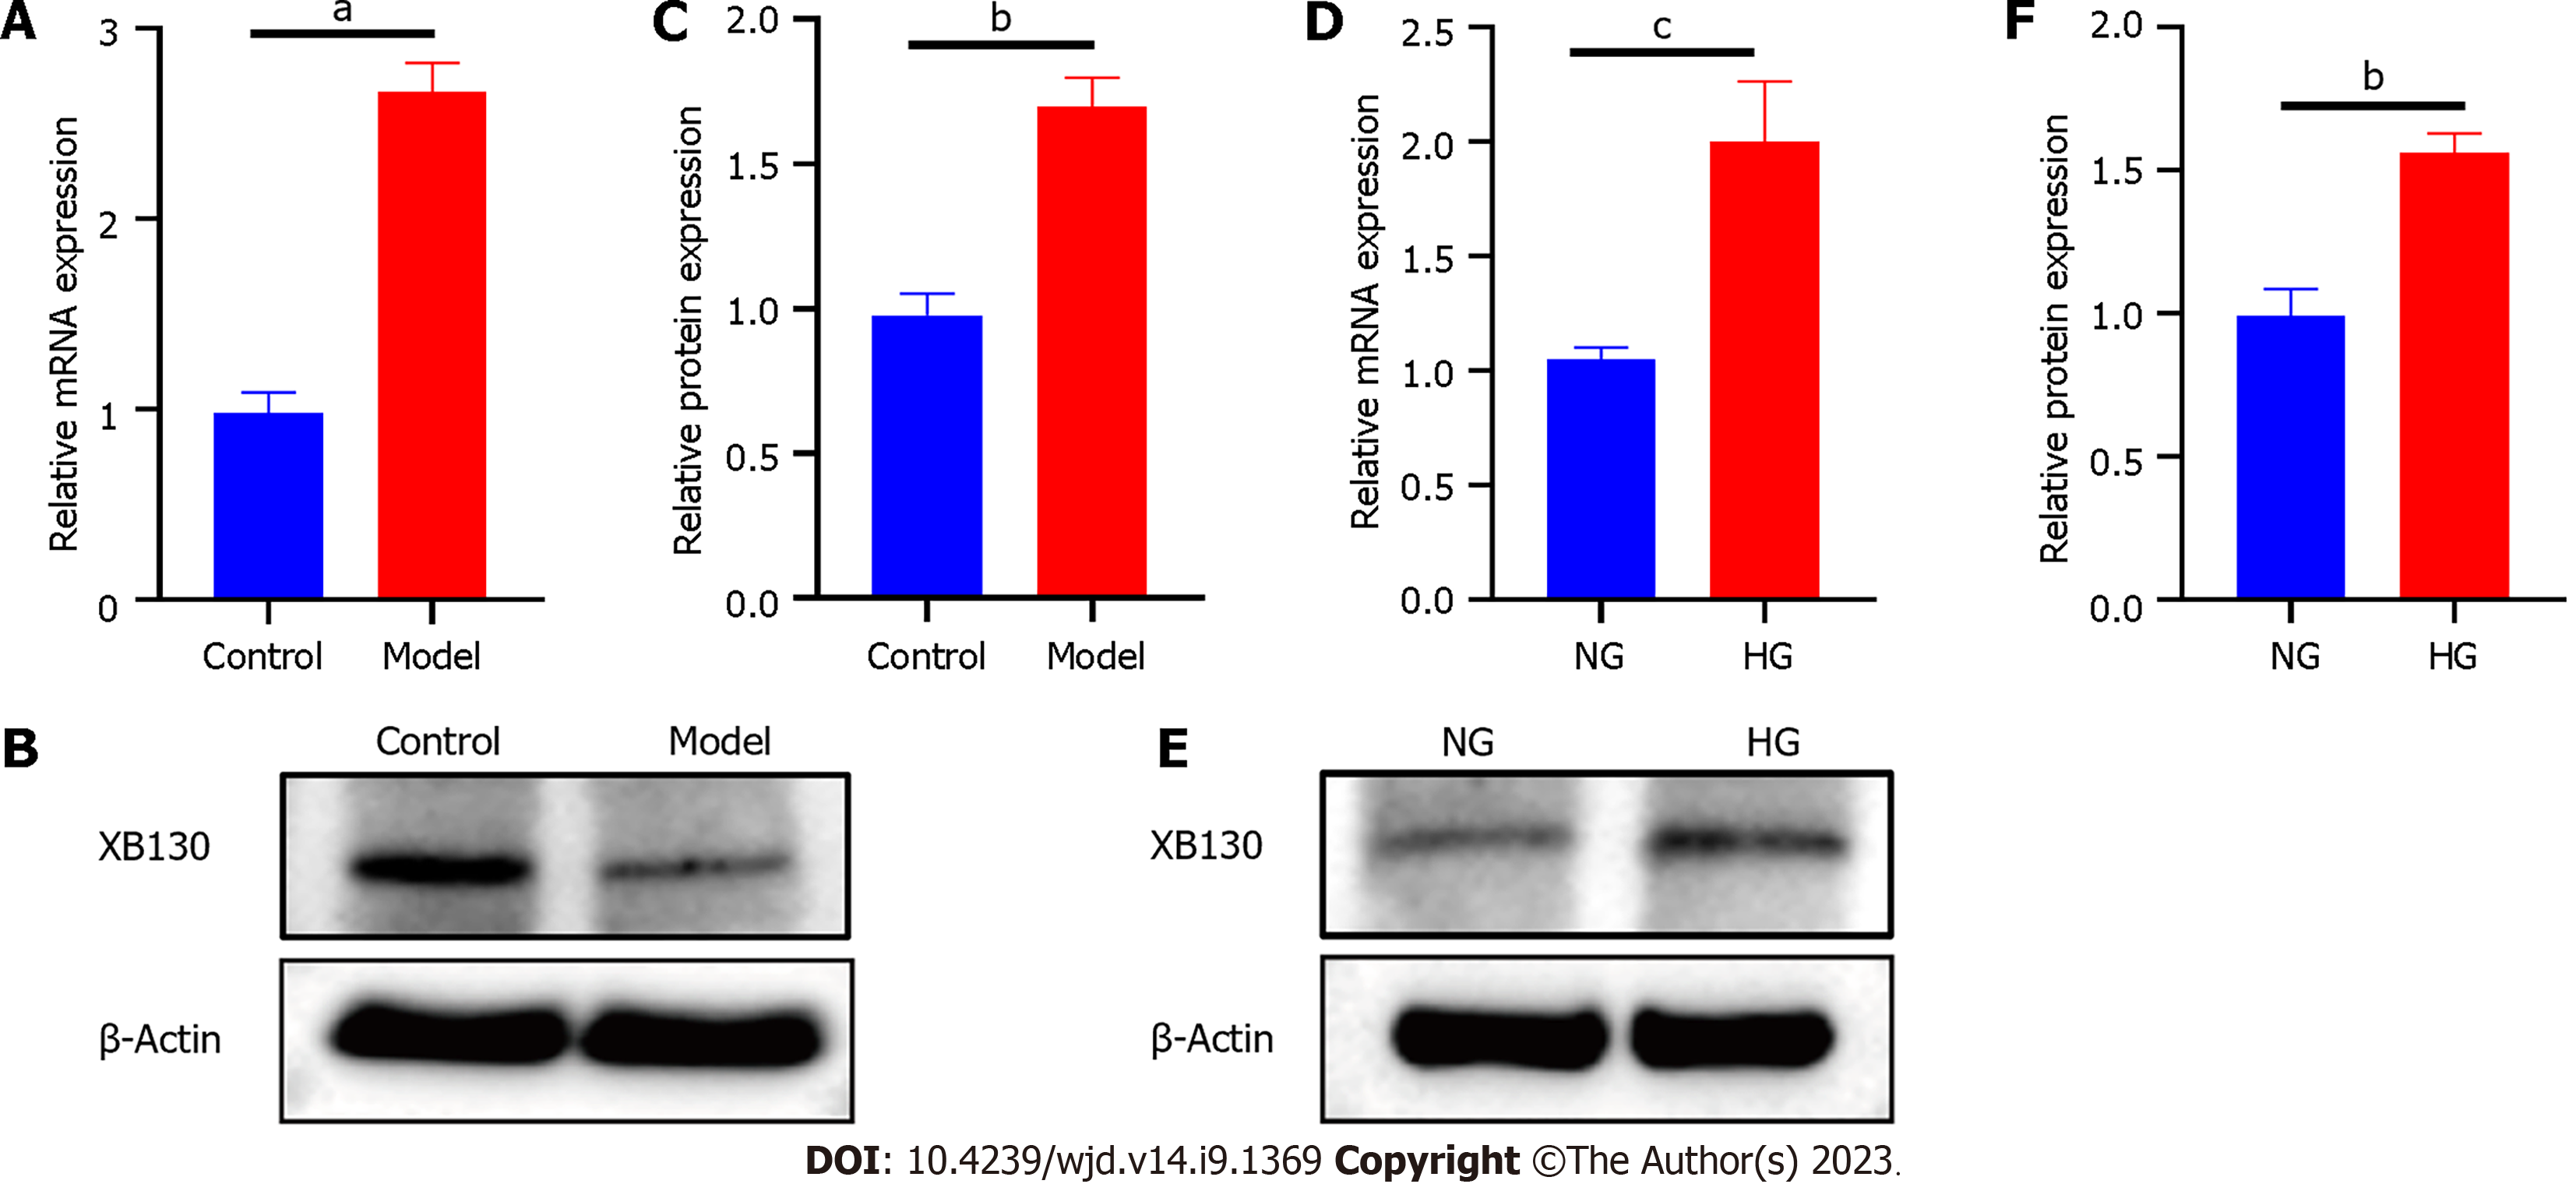
Figure 4 High glucose environment increased the expression of XB130.
A: Reverse transcription-quantitative polymerase chain reaction (RT-qPCR) analysis of XB130 mRNA expression in mice; B: Western blot analysis of XB130 protein expression in mice; C: Quantification of Western blot results; D: RT-qPCR analysis of XB130 mRNA expression in human umbilical vein endothelial cells (HUVECs); E: Western blot analysis of XB130 protein expression in HUVECs; F: Quantification of Western blot results. cP < 0.05, bP < 0.01, aP < 0.001, compared to the control or NG group.
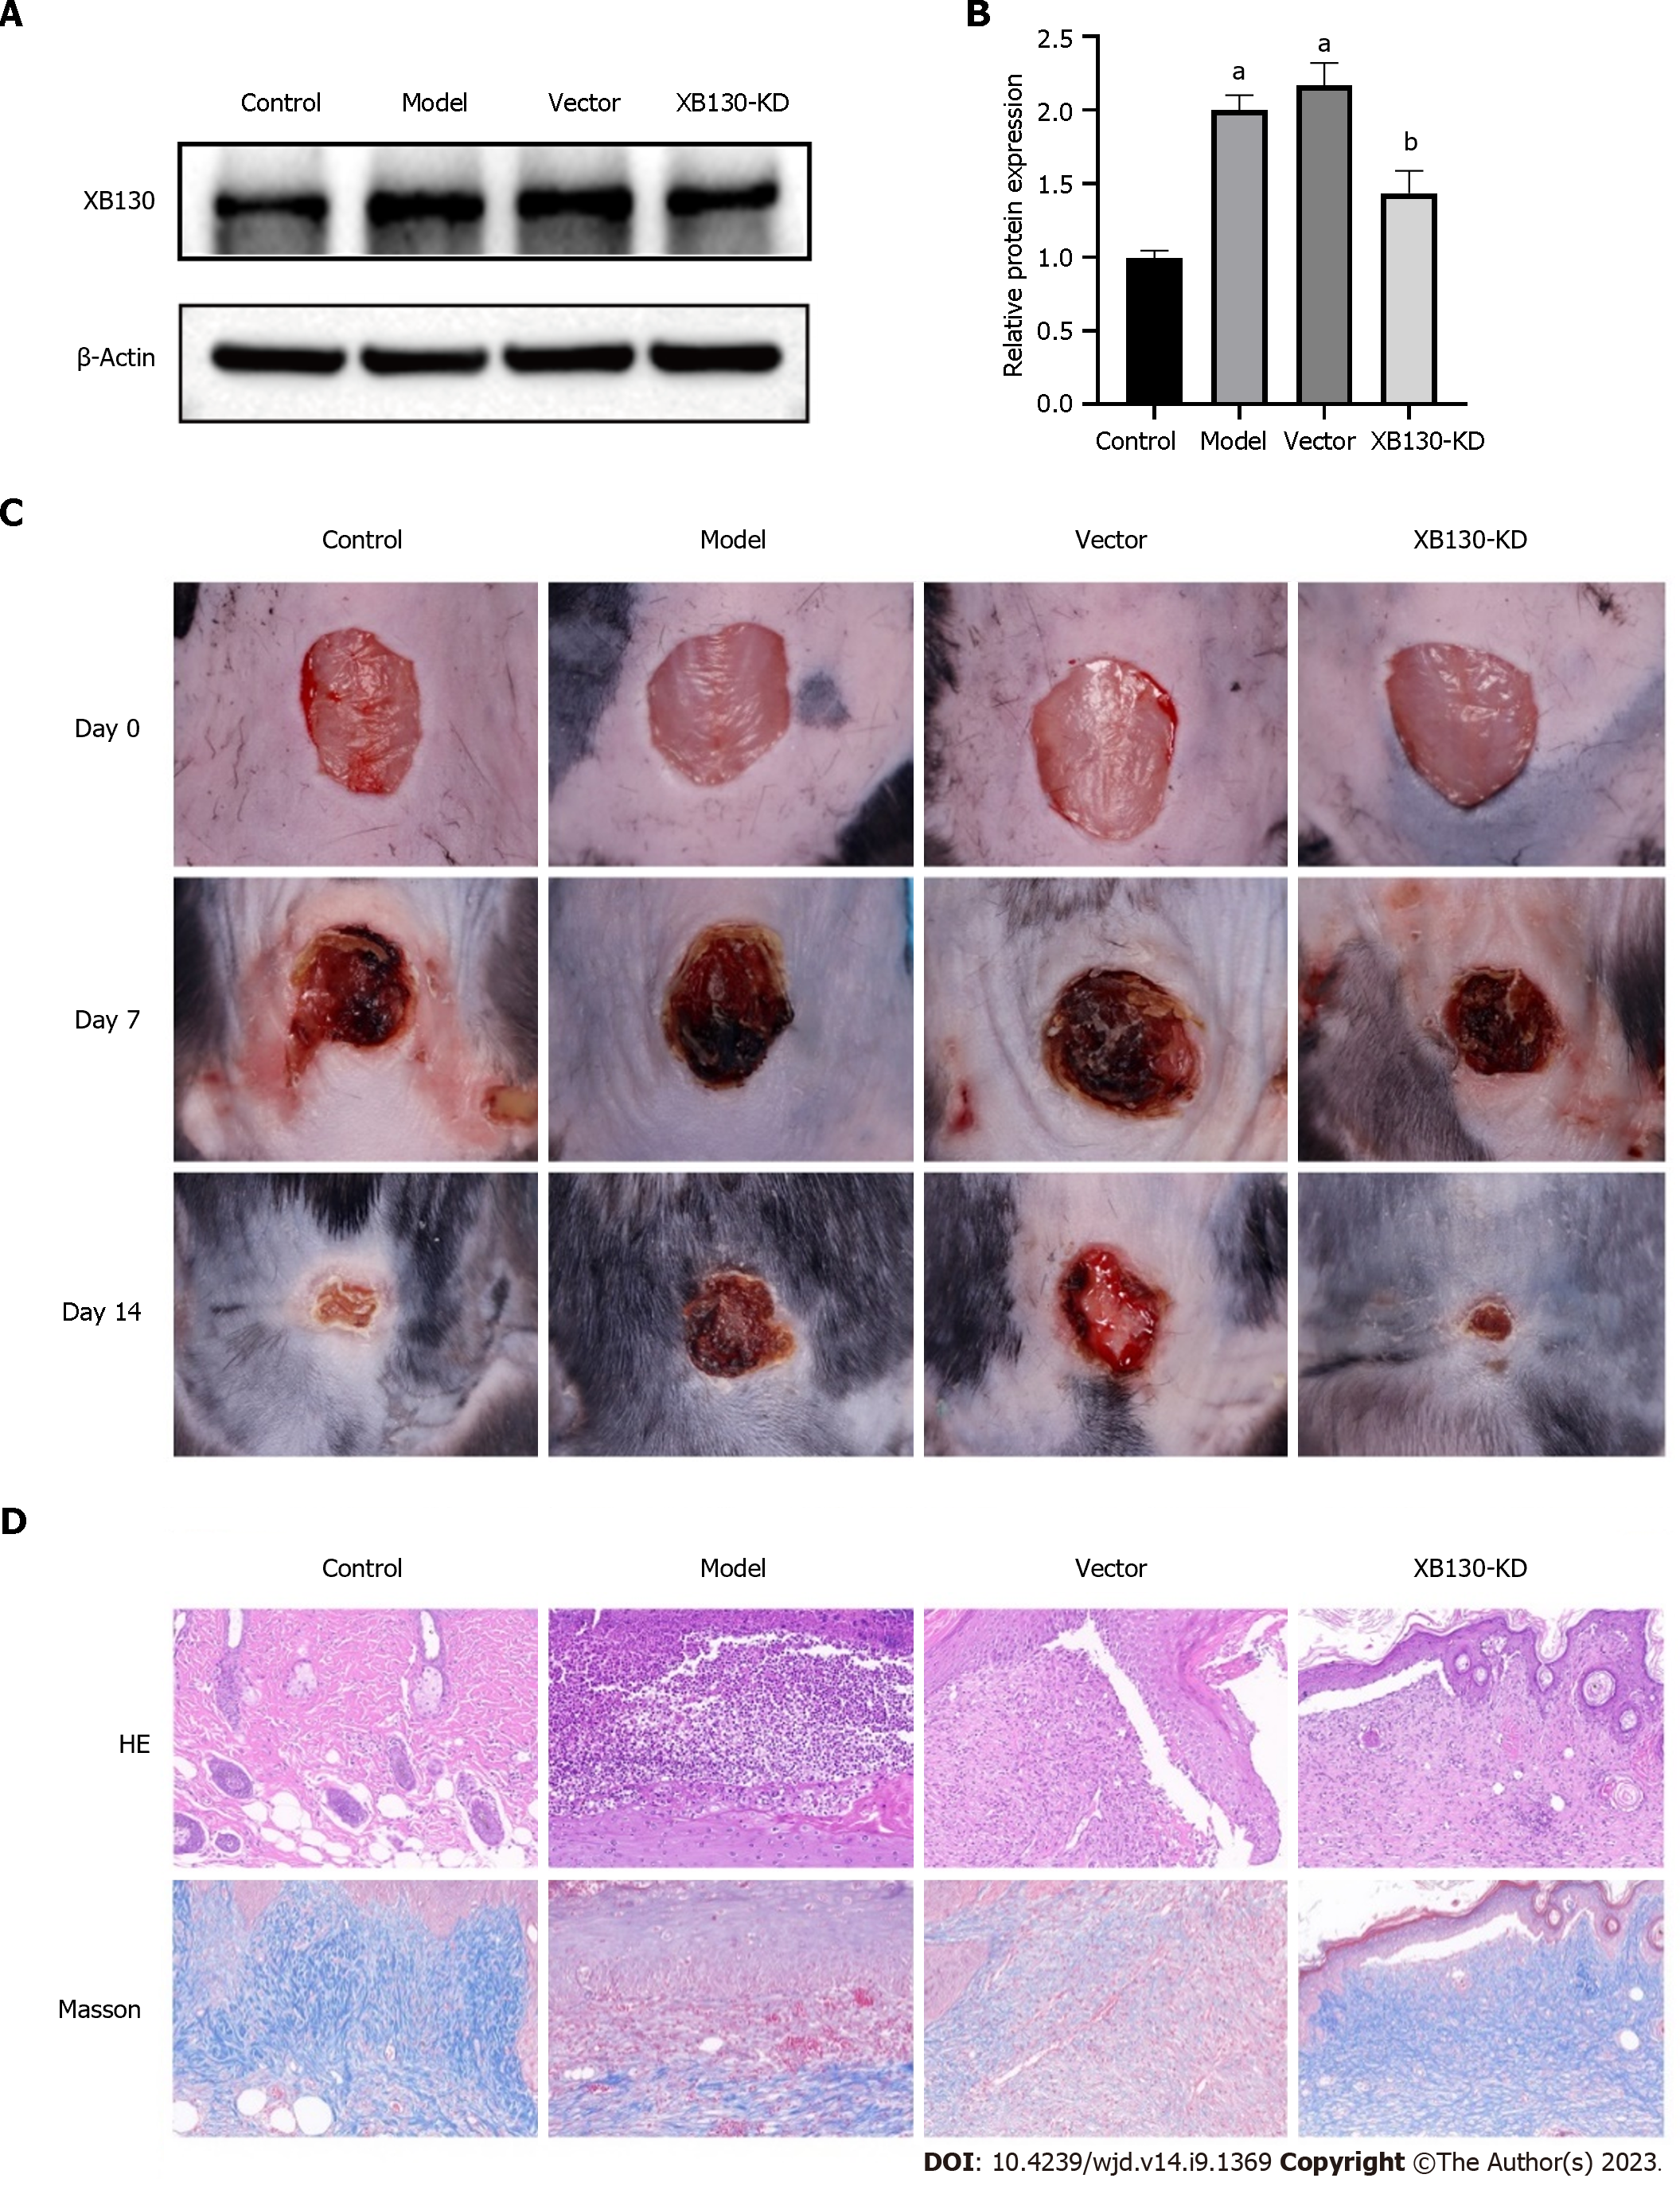
Figure 5 Knock-down of XB130 accelerated wound healing in diabetic mice.
A: Western blot analysis of XB130 protein expression in each group; B: Quantification of Western blot results; C: Representative skin wound images from control and model mice at day 0 d, 7 d, 14 d, control (n = 10), model (n = 10), Vector (n = 10), and XB130-KD (n = 10); D: HE and Masson staining of skin wound in each group. aP < 0.001, compared to the Control group; bP < 0.01, compared to the Vector group.
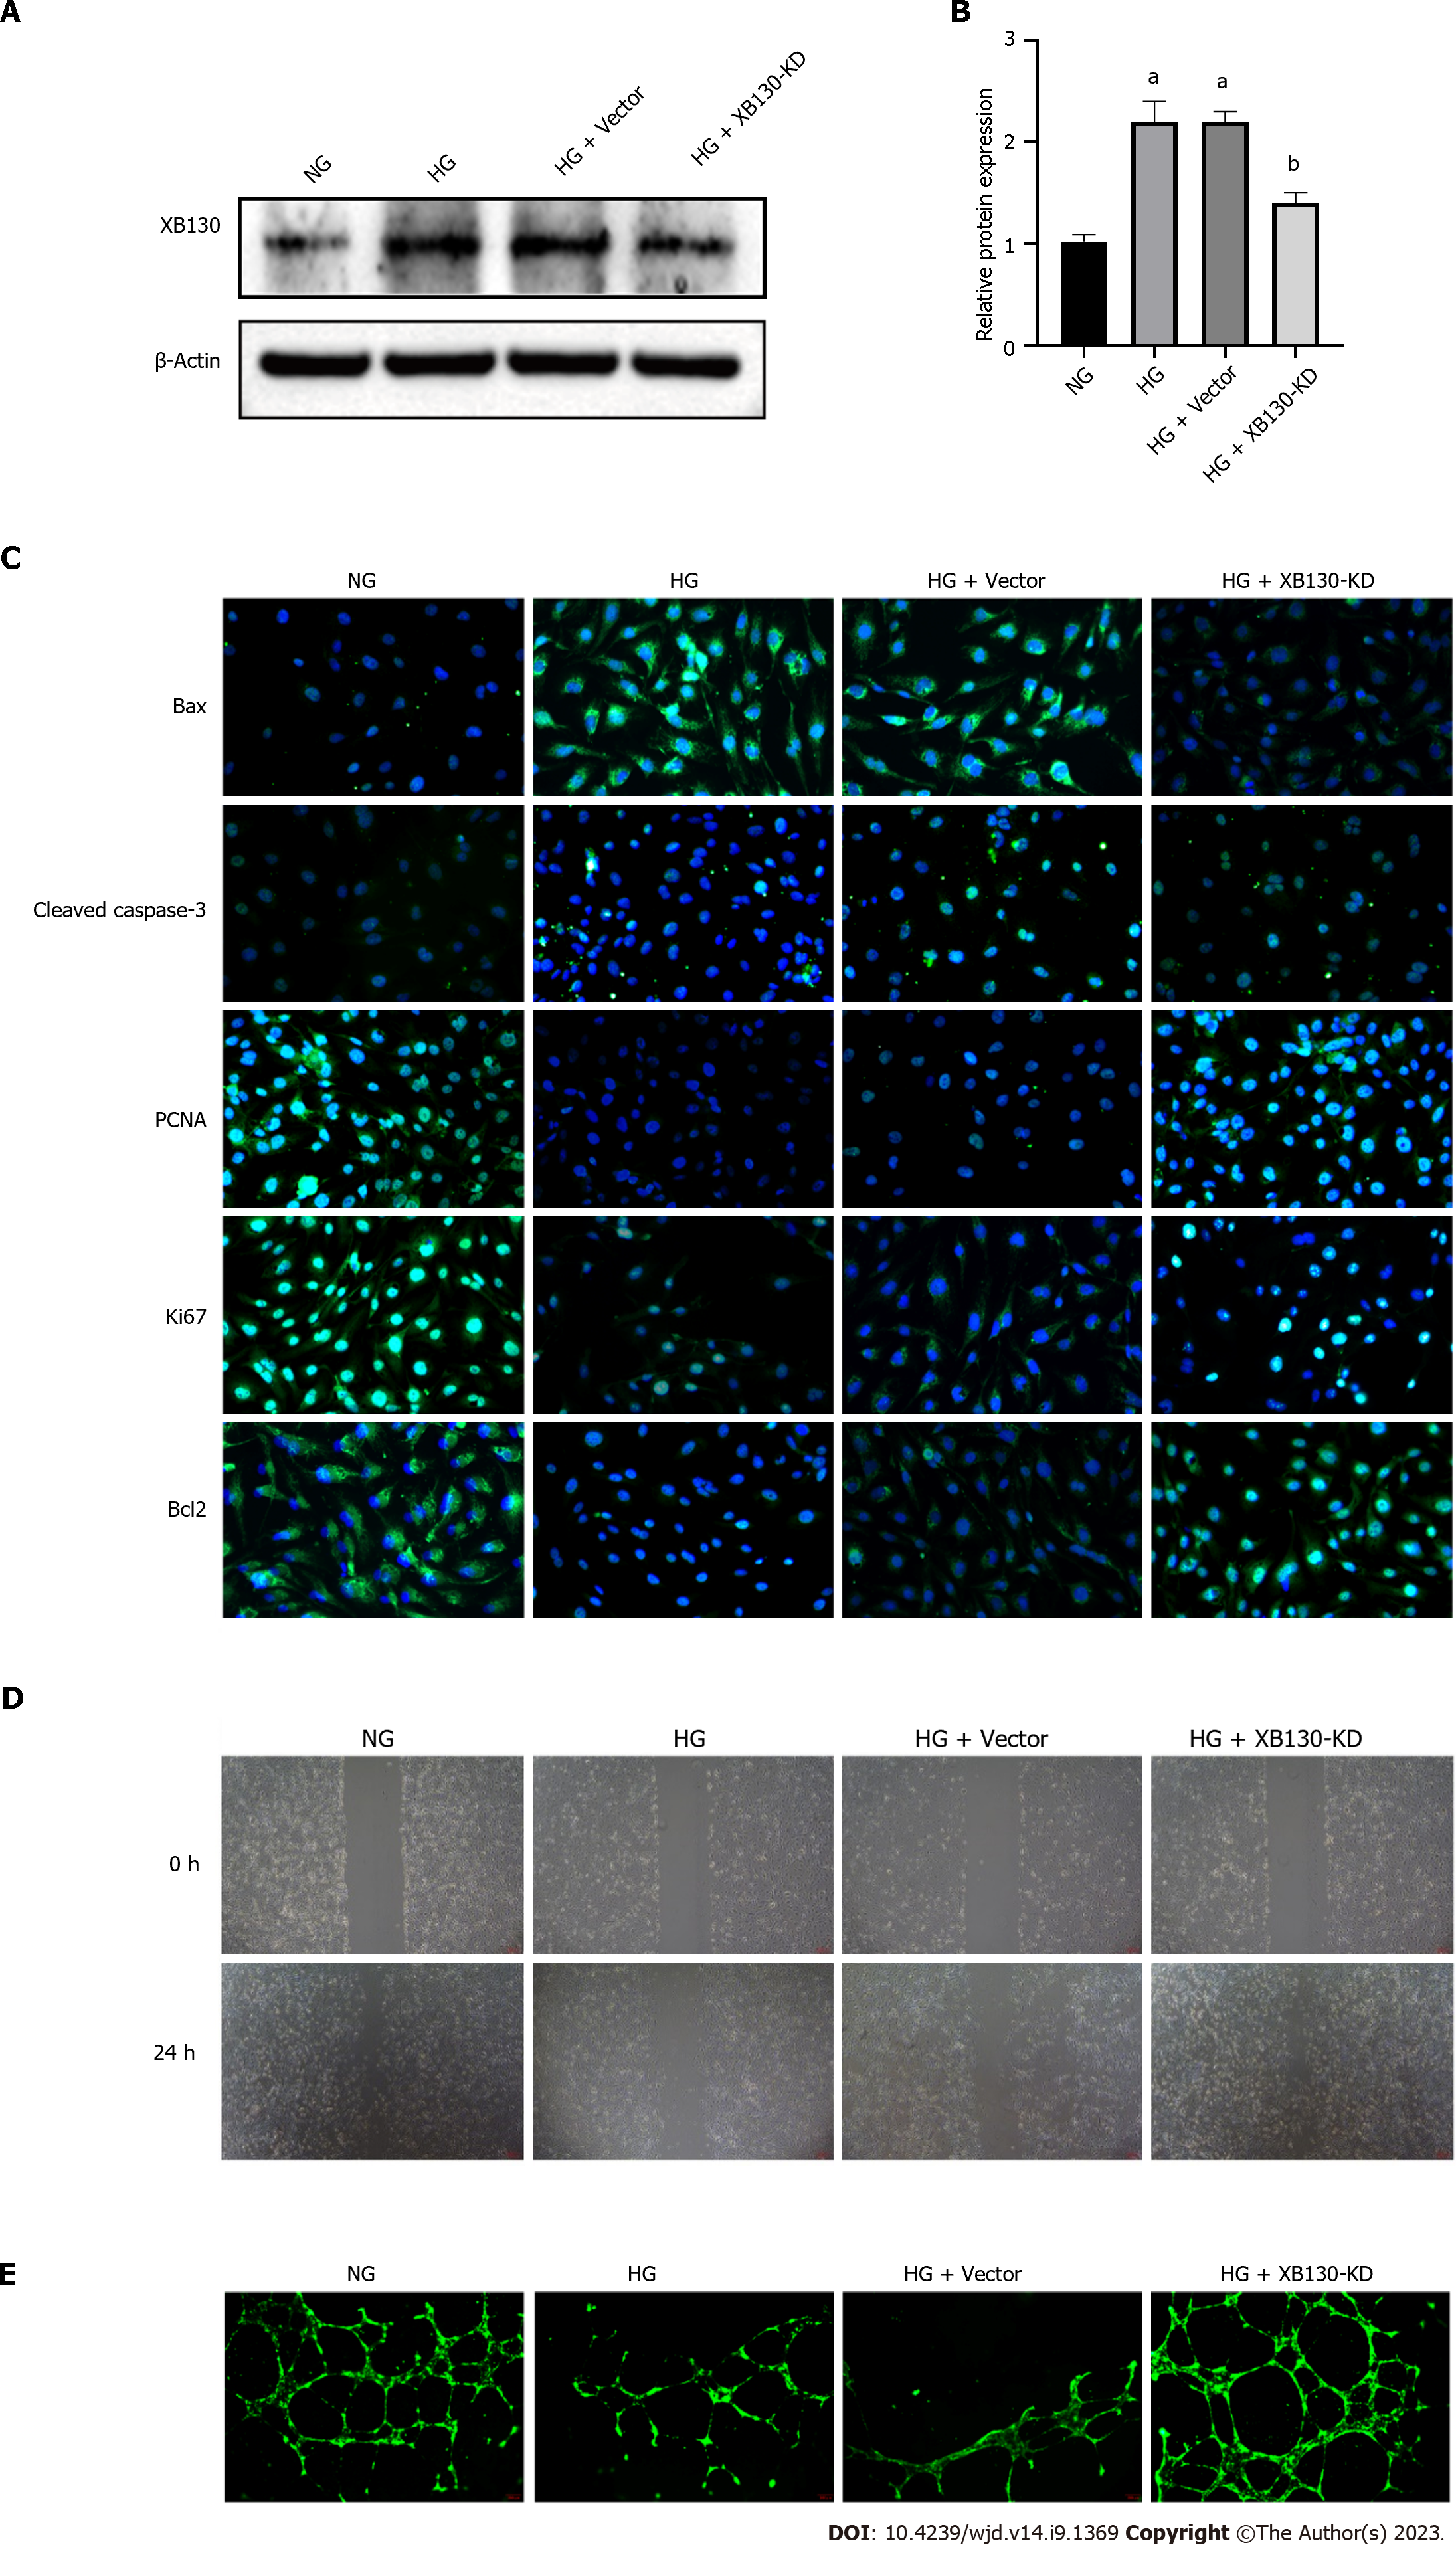
Figure 6 Knockdown of XB130 attenuated hyperglycemia-induced inhibitory effects on proliferation and tubule formation of human umbilical vein endothelial cells.
A: Western blot analysis of XB130 protein expression in human umbilical vein endothelial cells; B: Quantification of Western blot results; C: Immunofluorescence staining of Bax, cleaved caspase-3, PCNA, Ki67, and Bcl2 in each group; D: Wound healing assay in each group, scale bars = 200 μm; E: Capillary-like tubule formation, scale bars = 200 μm. aP < 0.001, compared to the high glucose group; bP < 0.001, compared to the HG + Vector group.
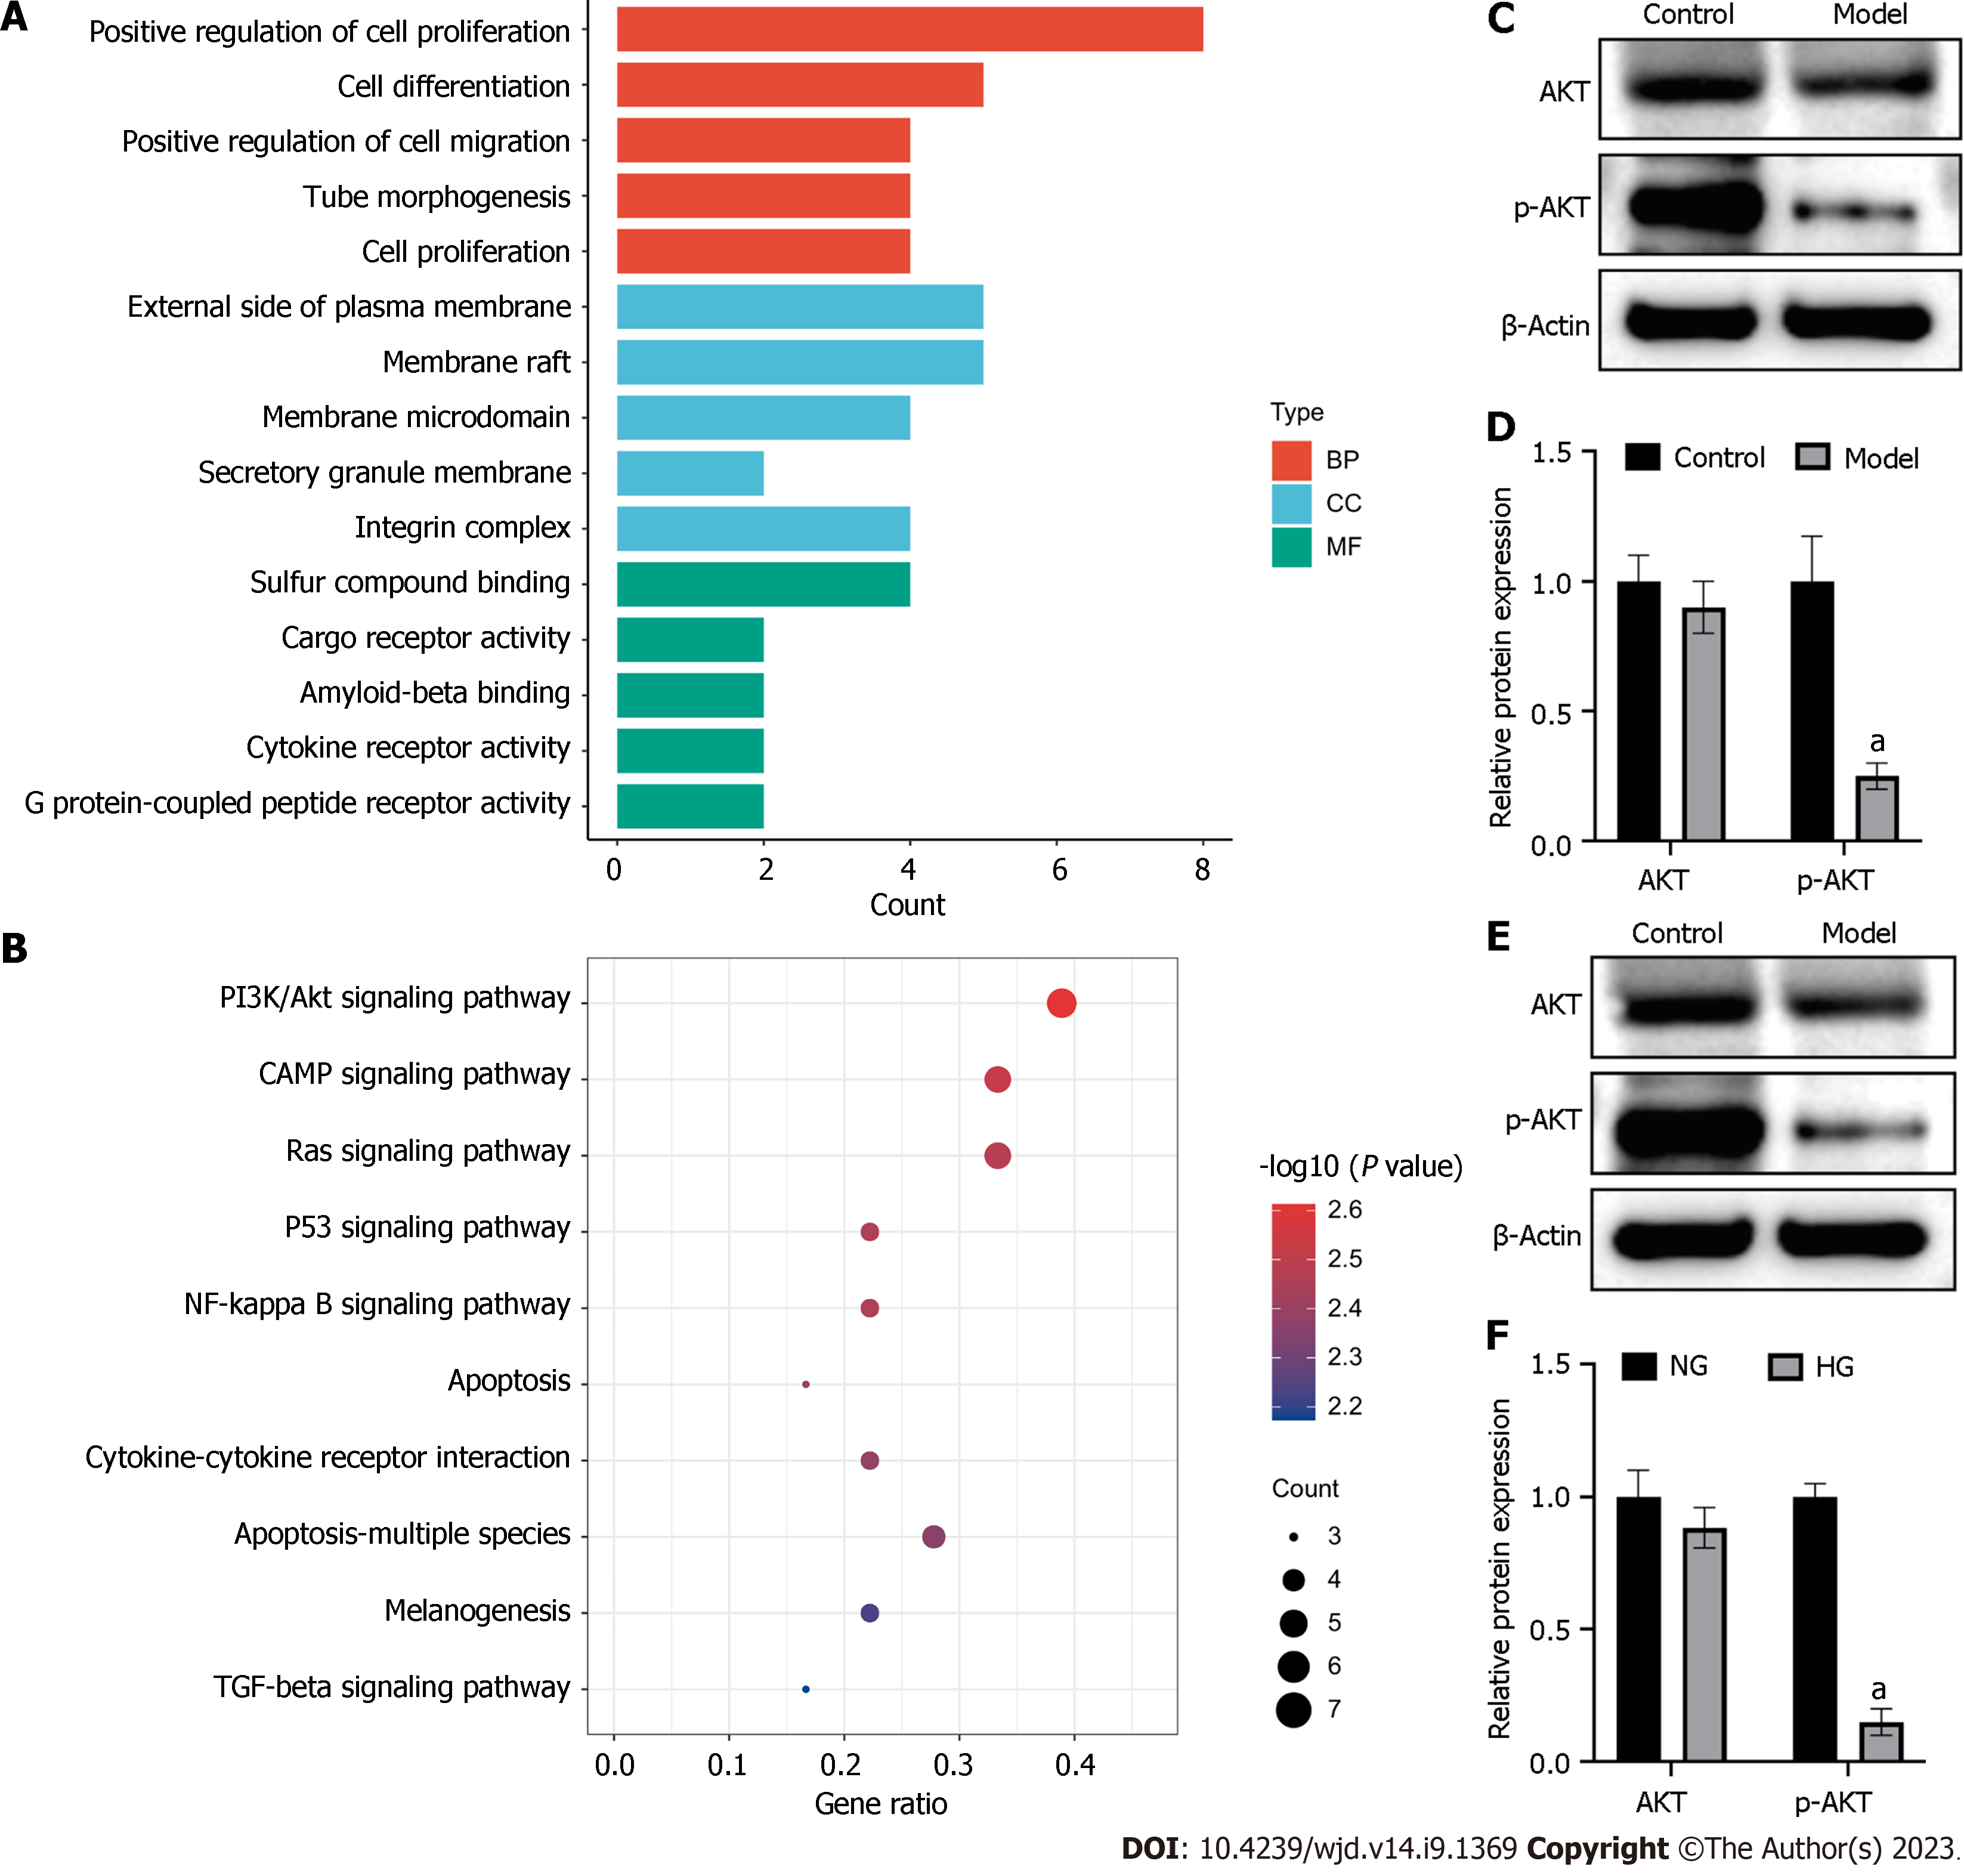
Figure 7 High glucose inhibited PI3K/Akt signalling pathway in vivo and in vitro.
A: Barplot of Gene Ontology enrichment analysis; B: Dotplot of Kyoto Encyclopedia of Genes and Genomes pathway analysis; C: Western blot analysis of AKT and p-AKT expression in mice; D: Quantification of Western blot results; E: Western blot analysis of AKT and p-AKT expression in human umbilical vein endothelial cells (HUVECs); F: Quantification of Western blot results. aP < 0.01, compared to the control or NG group.
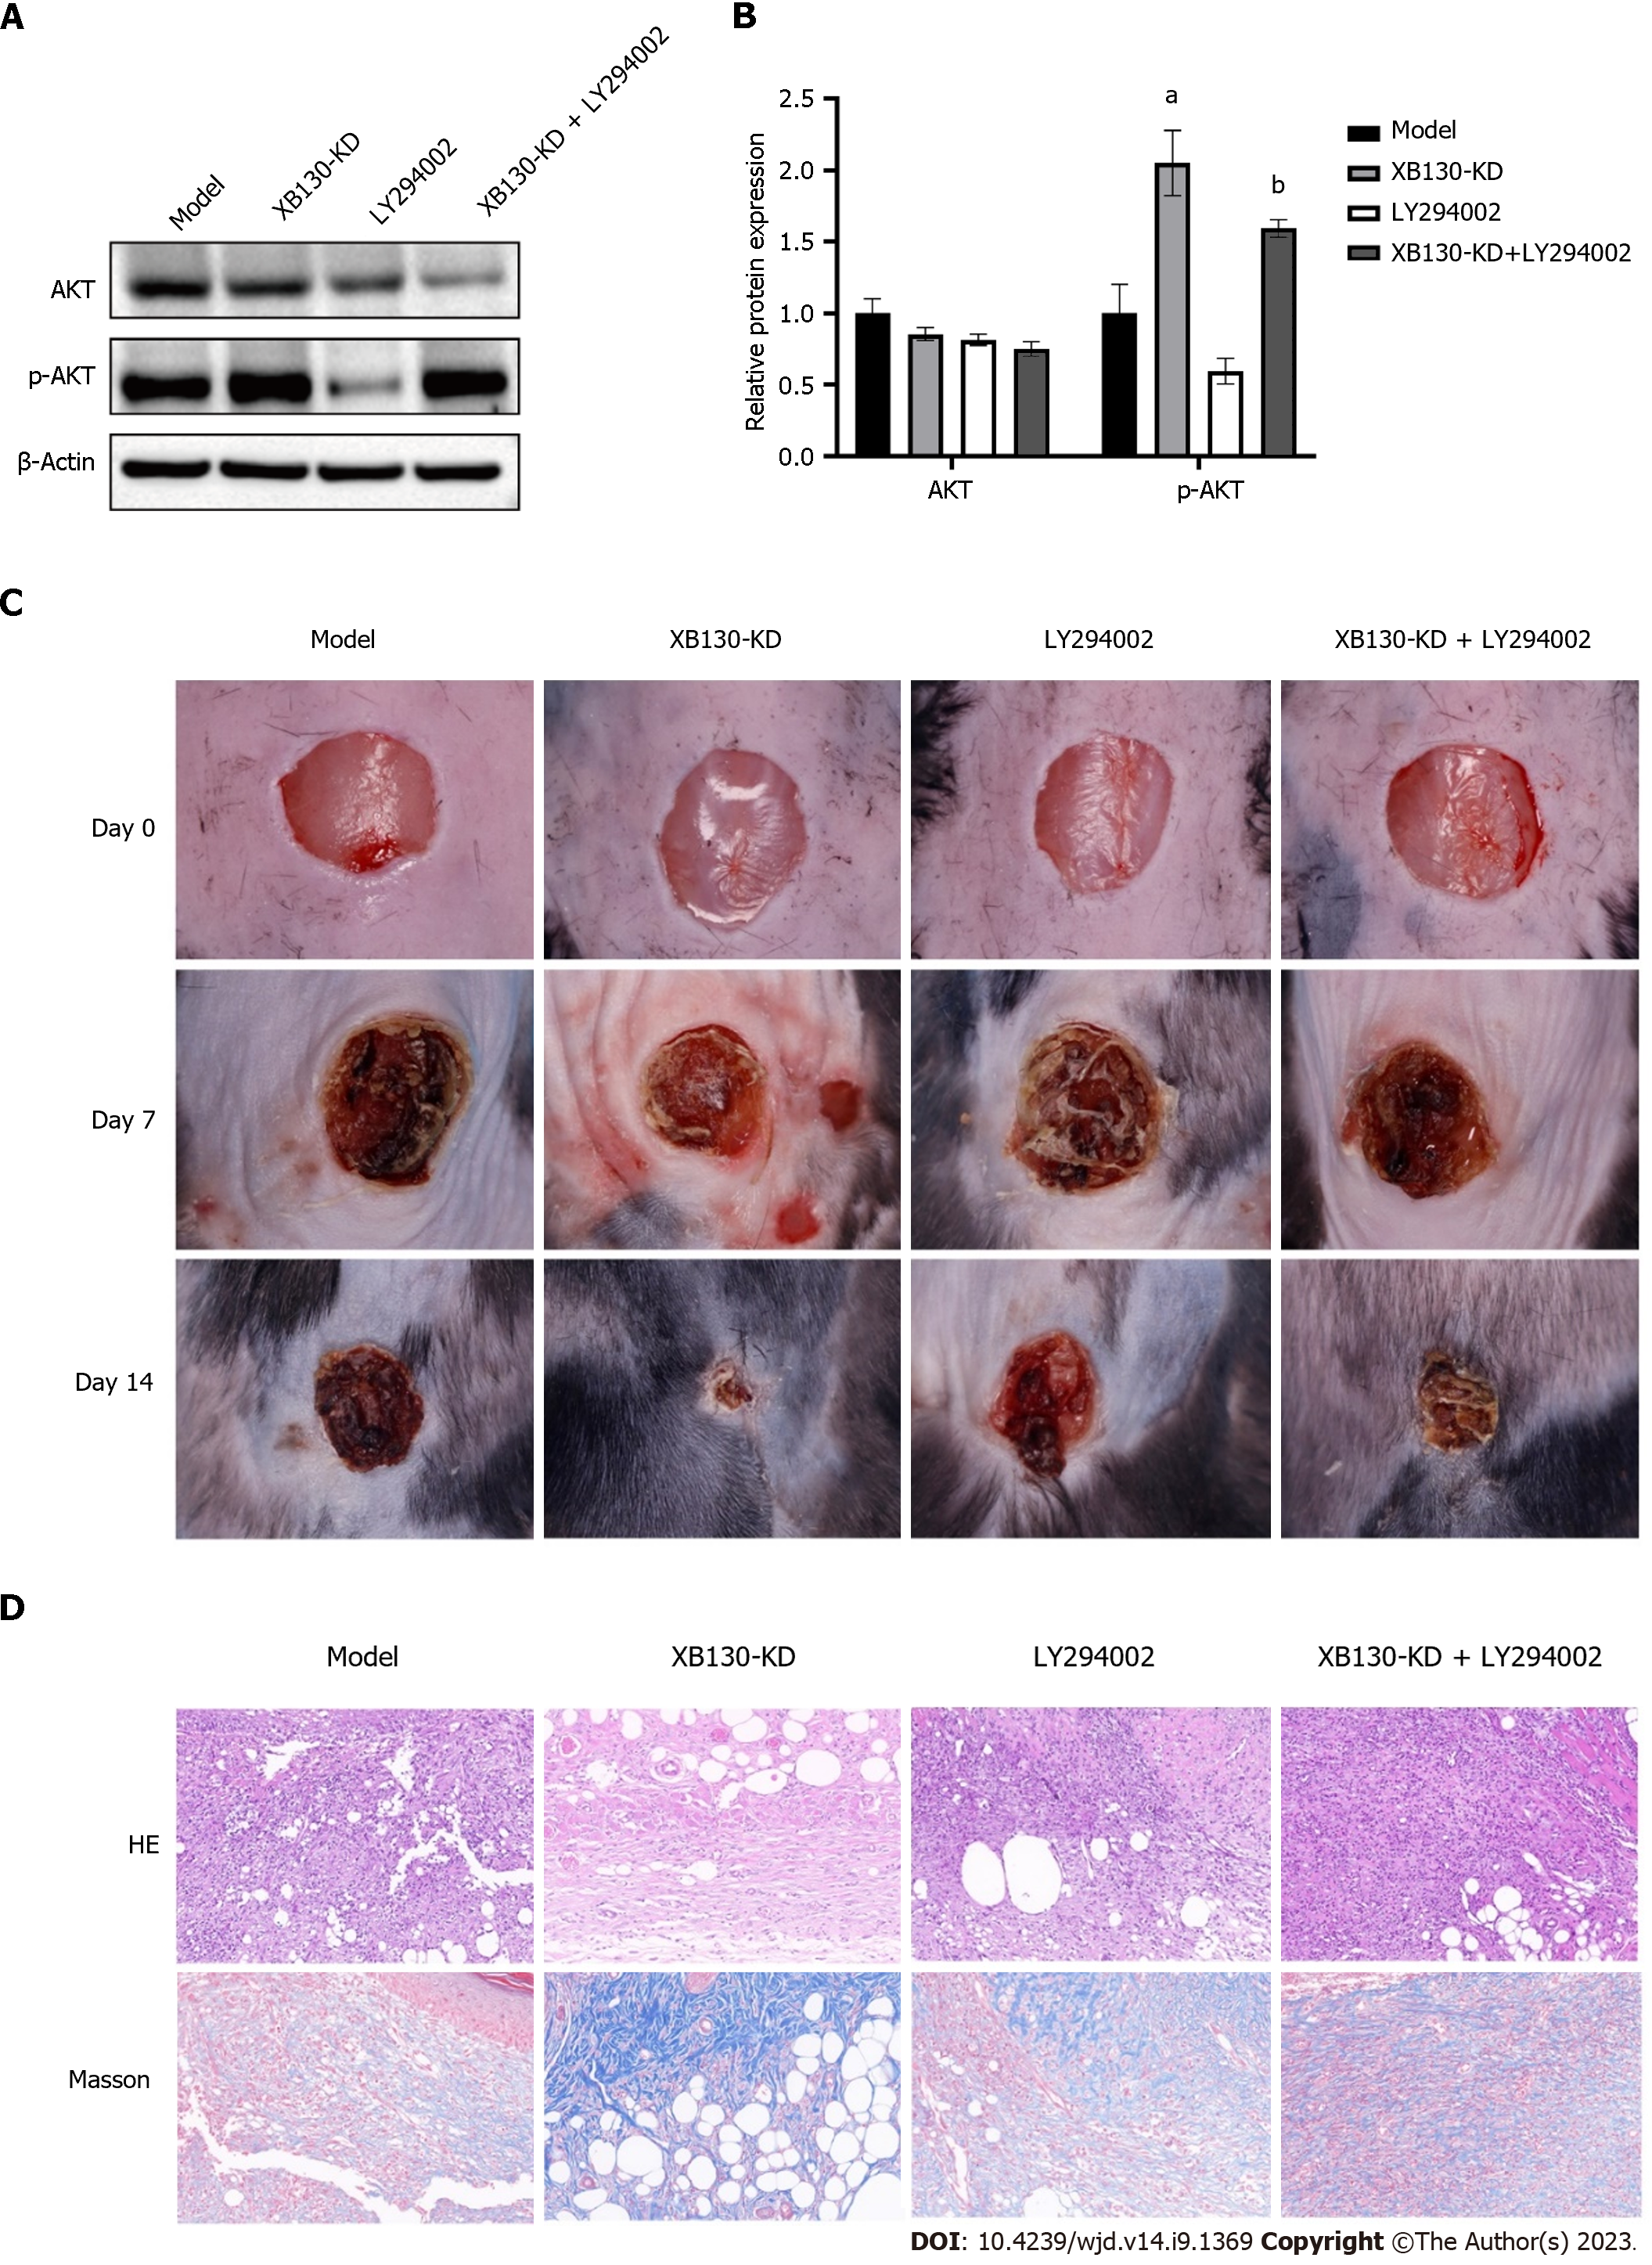
Figure 8 Knock-down of XB130 accelerated wound healing in diabetic mice via PI3K/Akt signalling pathway.
A: Western blot analysis of AKT and p-AKT expression in each group; B: Quantification of Western blot results; C: Representative skin wound images from control and model mice at day 0, 7, and 14, model (n = 10), XB130-KD (n = 10), LY294002 (n = 10), XB130-KD + LY294002 (n = 10); D: HE and Masson staining of skin wound in each group. aP < 0.01, compared to the control group; bP < 0.05, compared to the XB130-KD group.
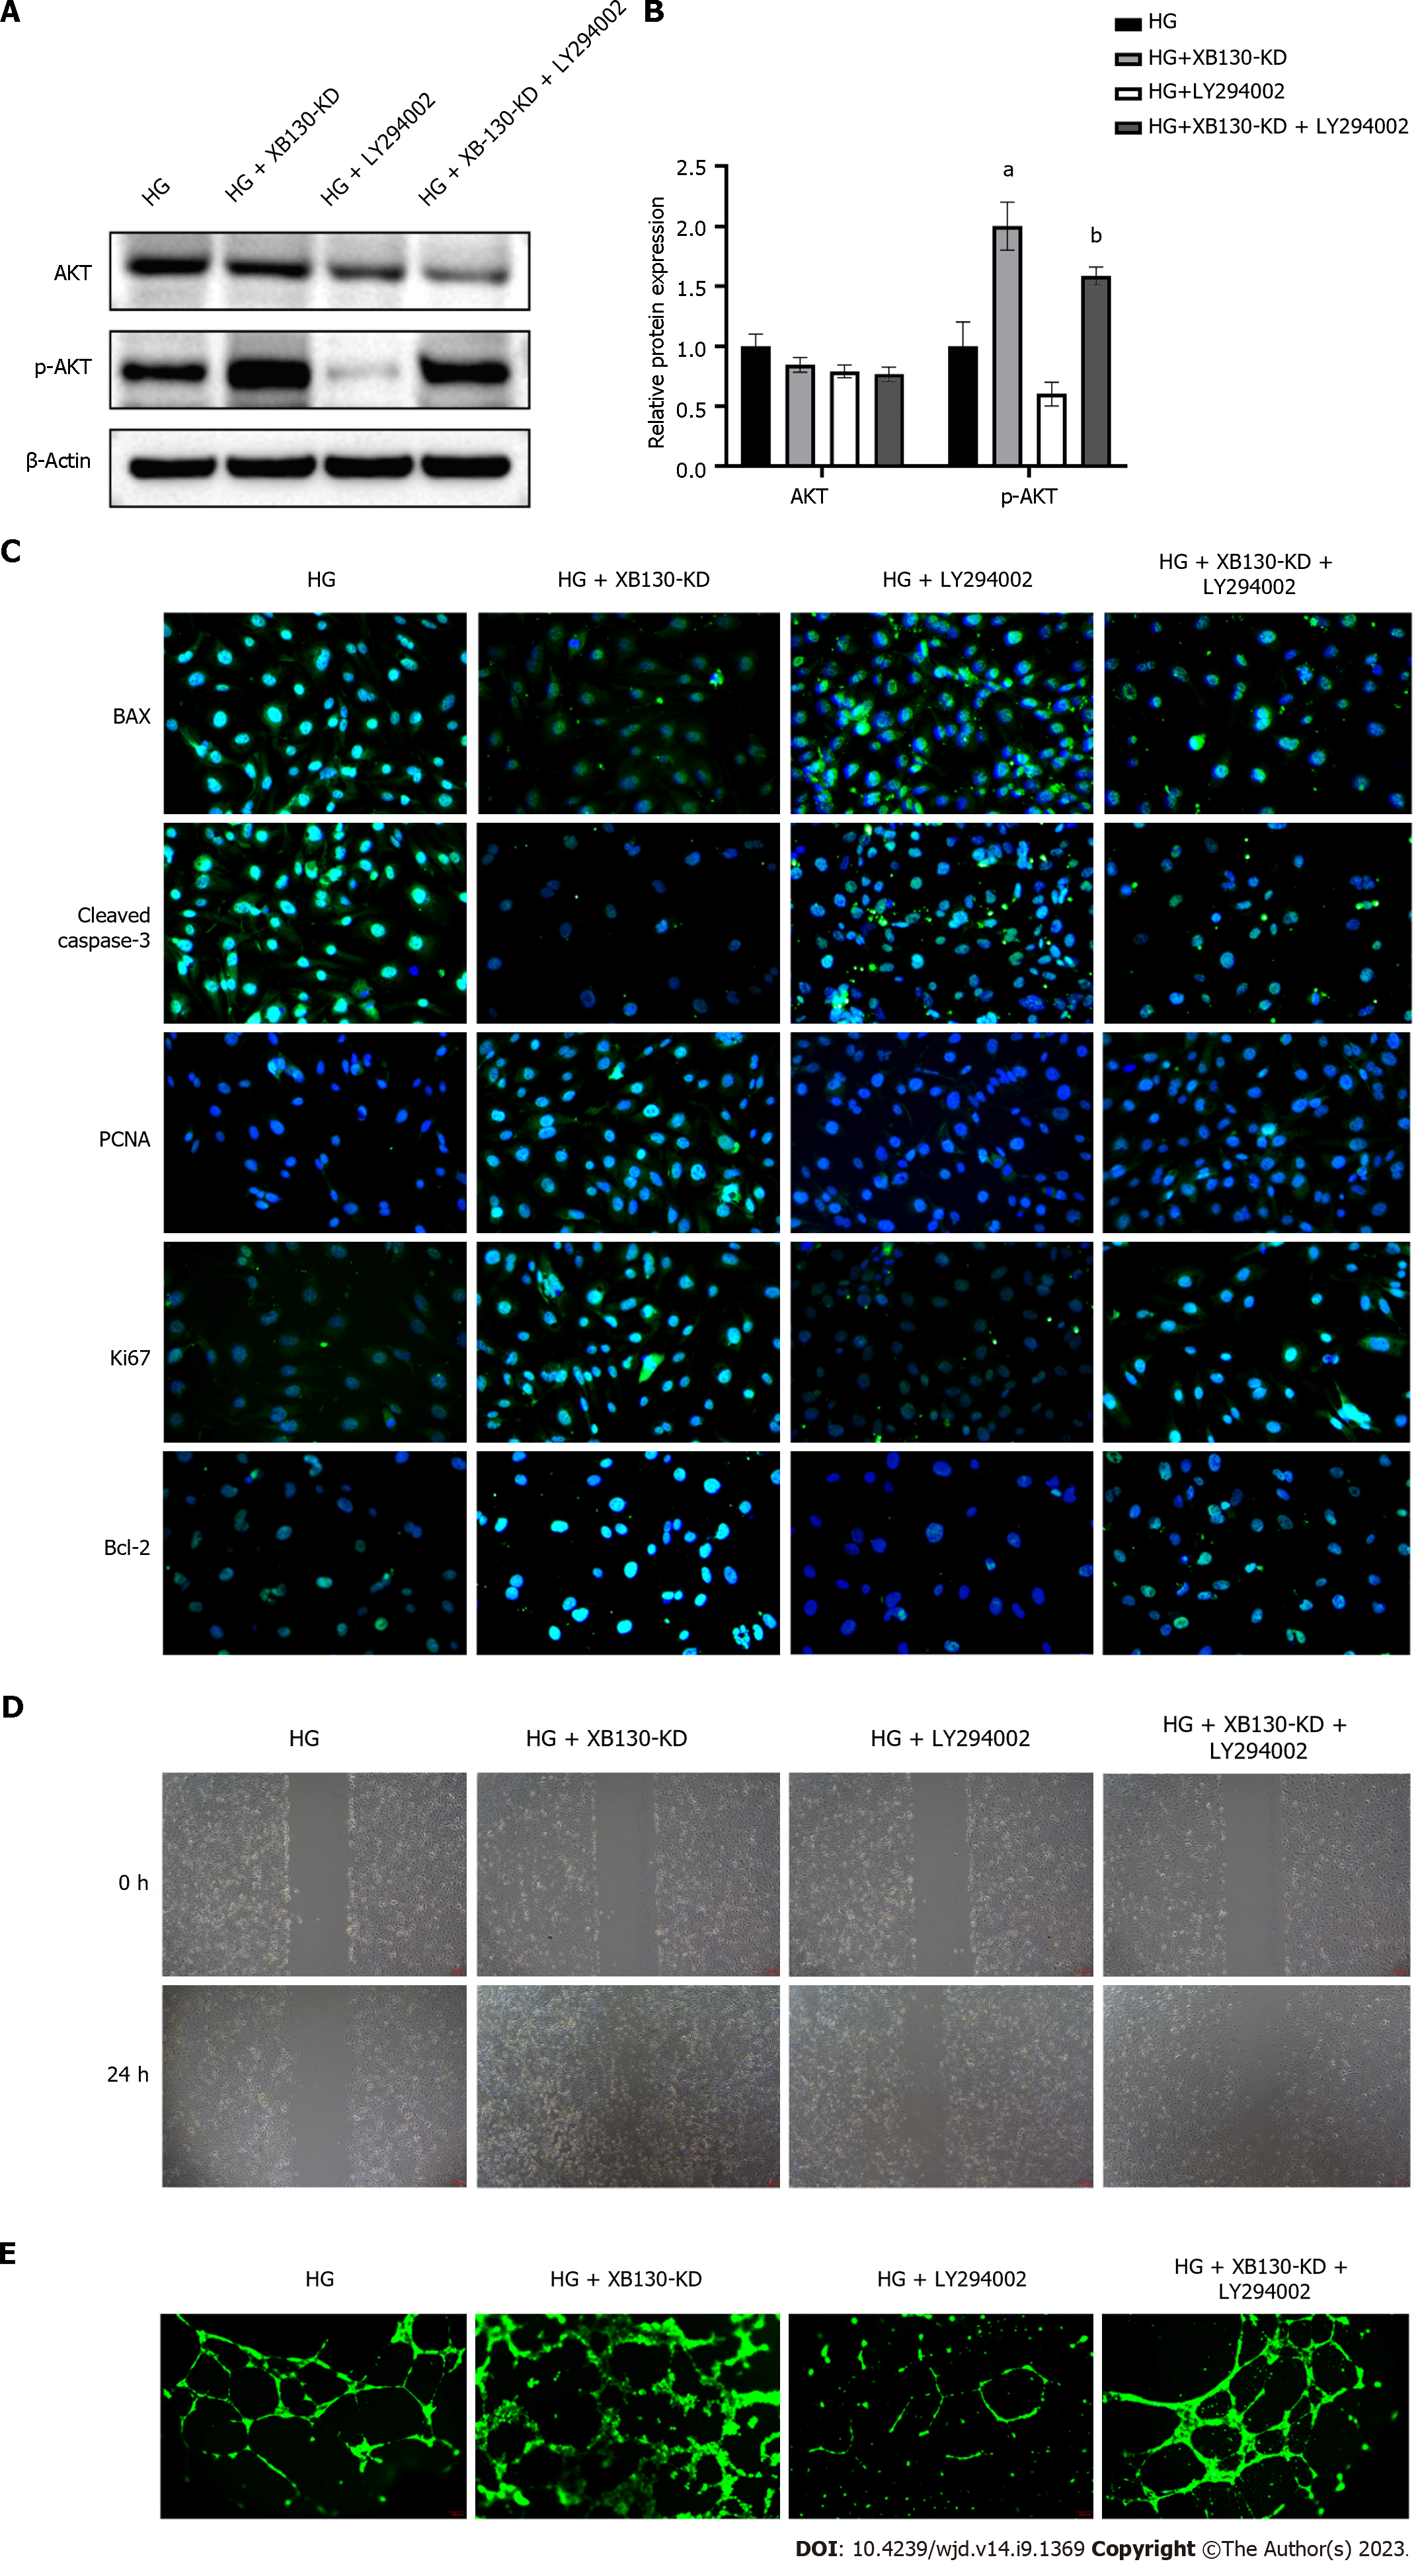
Figure 9 Knock-down of XB130 attenuated hyperglycemia-induced inhibitory effects on human umbilical vein endothelial cells via PI3K/Akt signalling pathway.
A: Western blot analysis of AKT and p-AKT expression in human umbilical vein endothelial cells; B: quantification of Western blot results; C: Immunofluorescence staining of Bax, cleaved caspase-3, PCNA, Ki67, and Bcl2 in each group; D: Wound healing assay in each group, scale bars = 200 μm; E: Capillary-like tubule formation, scale bars = 200 μm. aP < 0.01, compared to the high glucose group; bP < 0.05, compared to the HG + XB130-KD group.
- Citation: Zhu XL, Hu DY, Zeng ZX, Jiang WW, Chen TY, Chen TC, Liao WQ, Lei WZ, Fang WJ, Pan WH. XB130 inhibits healing of diabetic skin ulcers through the PI3K/Akt signalling pathway. World J Diabetes 2023; 14(9): 1369-1384
- URL: https://www.wjgnet.com/1948-9358/full/v14/i9/1369.htm
- DOI: https://dx.doi.org/10.4239/wjd.v14.i9.1369


