Copyright
©The Author(s) 2023.
World J Diabetes. Feb 15, 2023; 14(2): 110-119
Published online Feb 15, 2023. doi: 10.4239/wjd.v14.i2.110
Published online Feb 15, 2023. doi: 10.4239/wjd.v14.i2.110
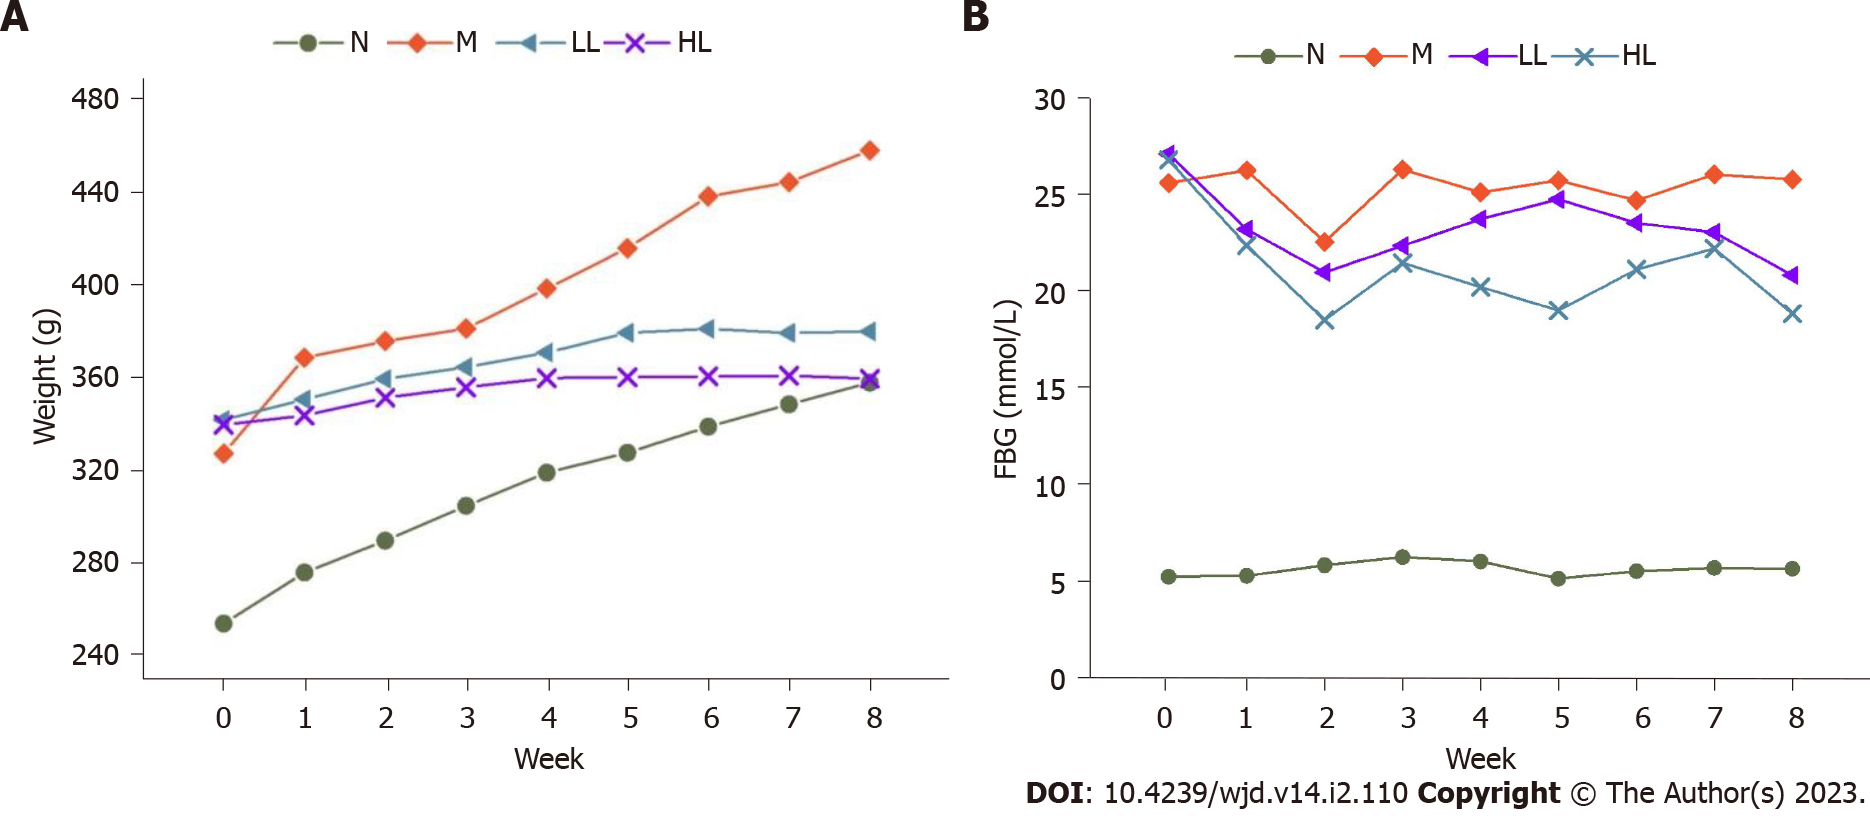
Figure 1 Weekly body weight and fasting blood glucose trend of rats in each group after liraglutide intervention.
A: Weekly body weight; B: Fasting blood glucose trend. N: Normal control; M: Model; HL: High-dose liraglutide; LL: Low-dose liraglutide; FBG: Fasting blood glucose.
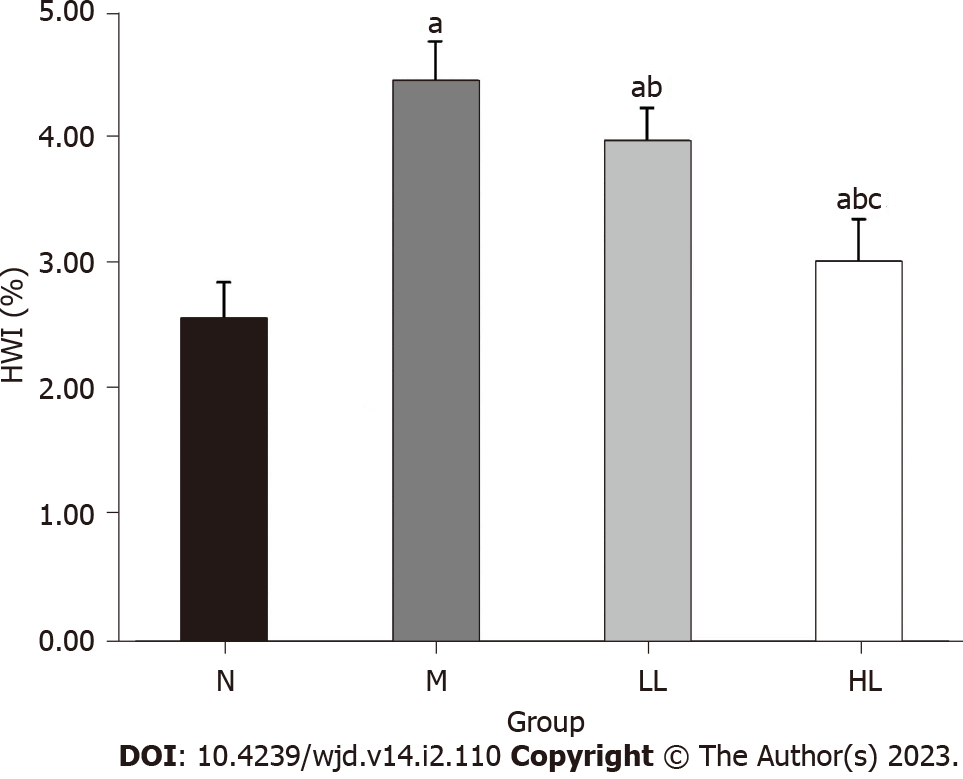
Figure 2 Comparison of heart weight index in each group.
Compared with group N, aP < 0.05; compared with group M, bP < 0.05; compared with group L, cP < 0.05. HWI: Heart weight index; N: Normal control; M: Model; HL: High-dose liraglutide; LL: Low-dose liraglutide.
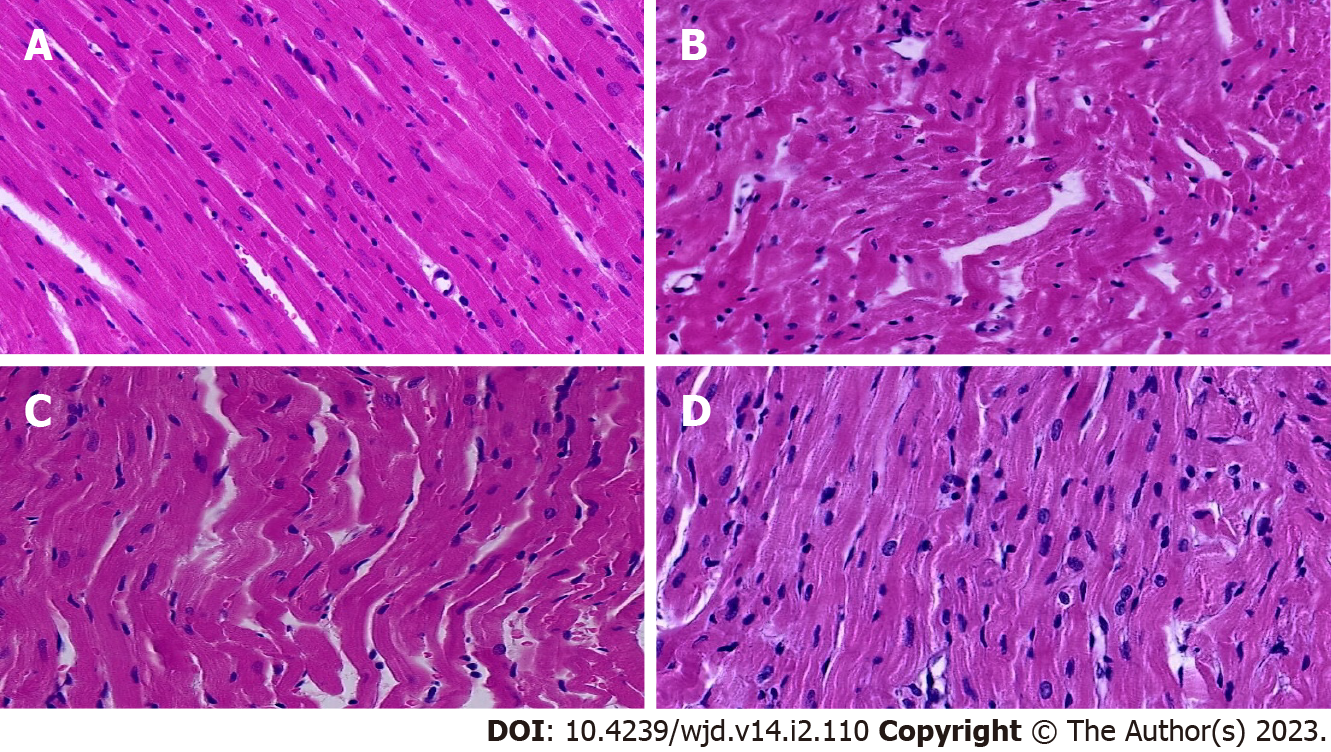
Figure 3 Haematoxylin and eosin staining of the hearts of rats in each group (400×).
A: Normal control group; B: Model group; C: Low-dose liraglutide group; D: High-dose liraglutide group.
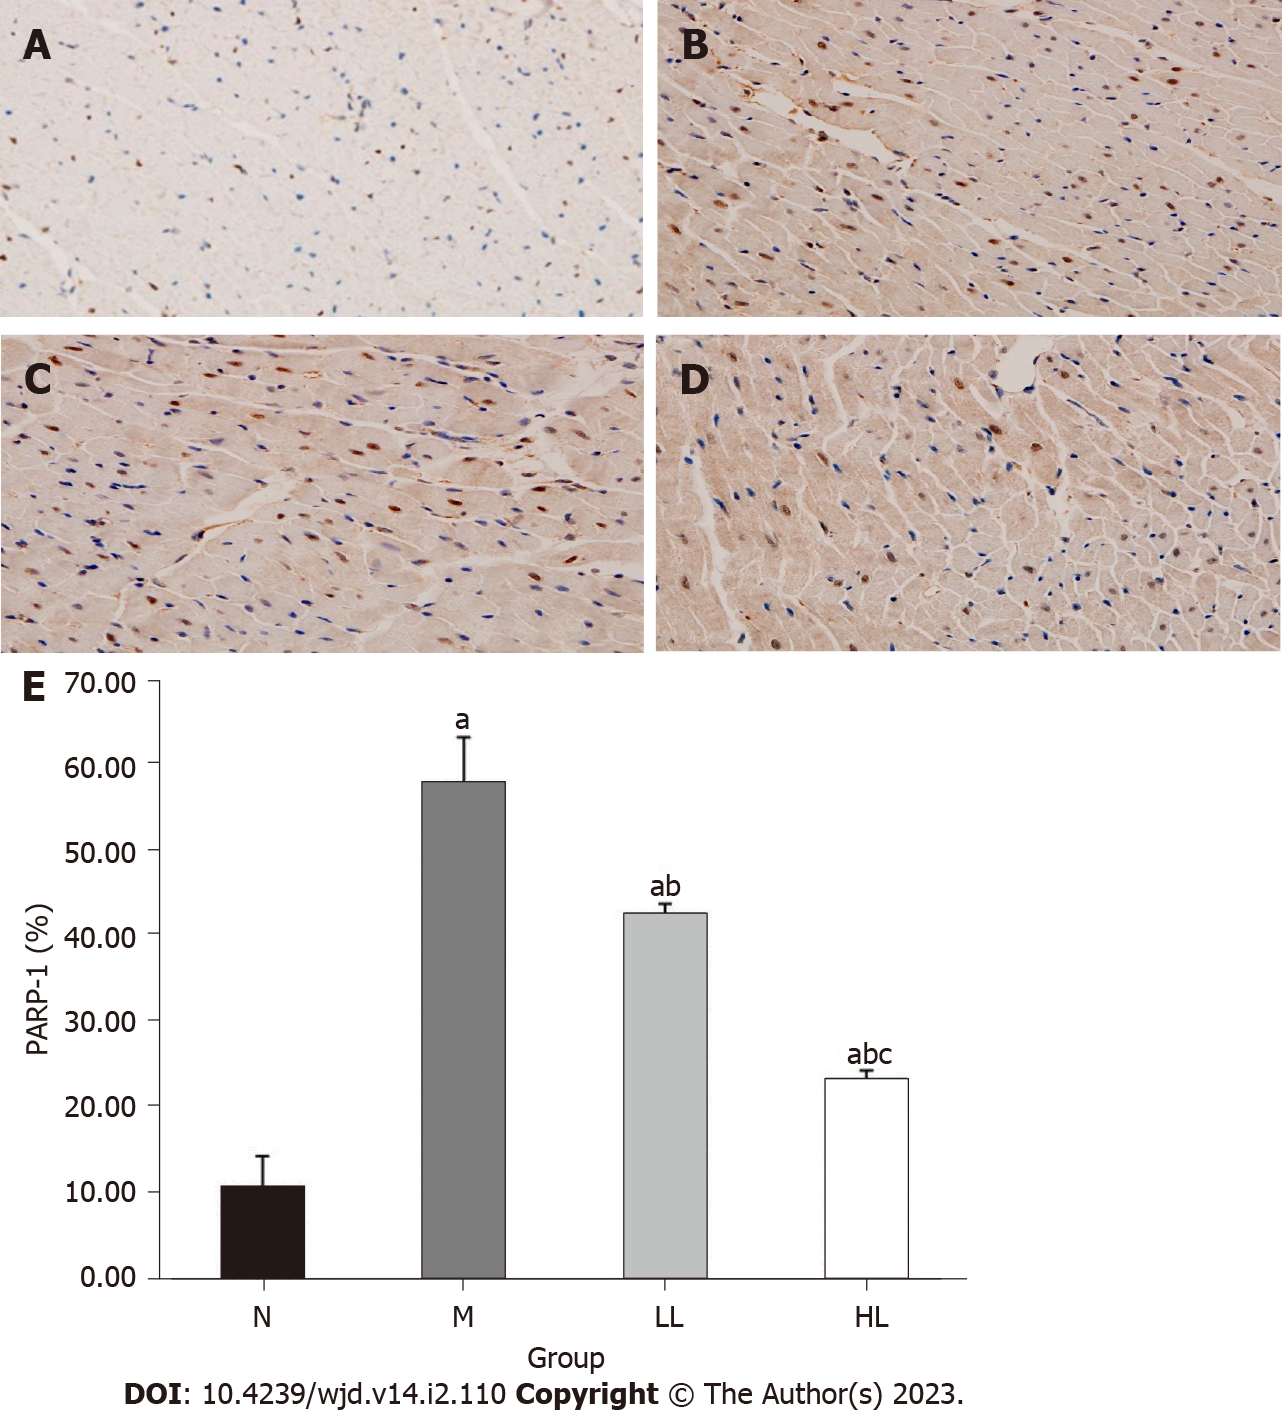
Figure 4 Comparison of immunohistochemistry of myocardial tissue in each group.
A-D: Polyadenosine diphosphate-ribose polymerase-1 (PARP-1) expression in heart tissue of rats in normal control group (A), model group (B), low-dose liraglutide group (C), and high-dose liraglutide group (D); E: Comparison of PARP-1 positive expression in heart tissue of rats in each group. Compared with group N, aP < 0.05; compared with group M, bP < 0.05; compared with group L, cP < 0.05. PARP-1: Polyadenosine diphosphate-ribose polymerase-1; N: Normal control; M: Model; HL: High-dose liraglutide; LL: Low-dose liraglutide.
- Citation: Xue DD, Zhang X, Li DW, Yang YL, Liu JJ. Protective effect of liraglutide on the myocardium of type 2 diabetic rats by inhibiting polyadenosine diphosphate-ribose polymerase-1. World J Diabetes 2023; 14(2): 110-119
- URL: https://www.wjgnet.com/1948-9358/full/v14/i2/110.htm
- DOI: https://dx.doi.org/10.4239/wjd.v14.i2.110


