Copyright
©The Author(s) 2022.
World J Diabetes. Aug 15, 2022; 13(8): 600-612
Published online Aug 15, 2022. doi: 10.4239/wjd.v13.i8.600
Published online Aug 15, 2022. doi: 10.4239/wjd.v13.i8.600
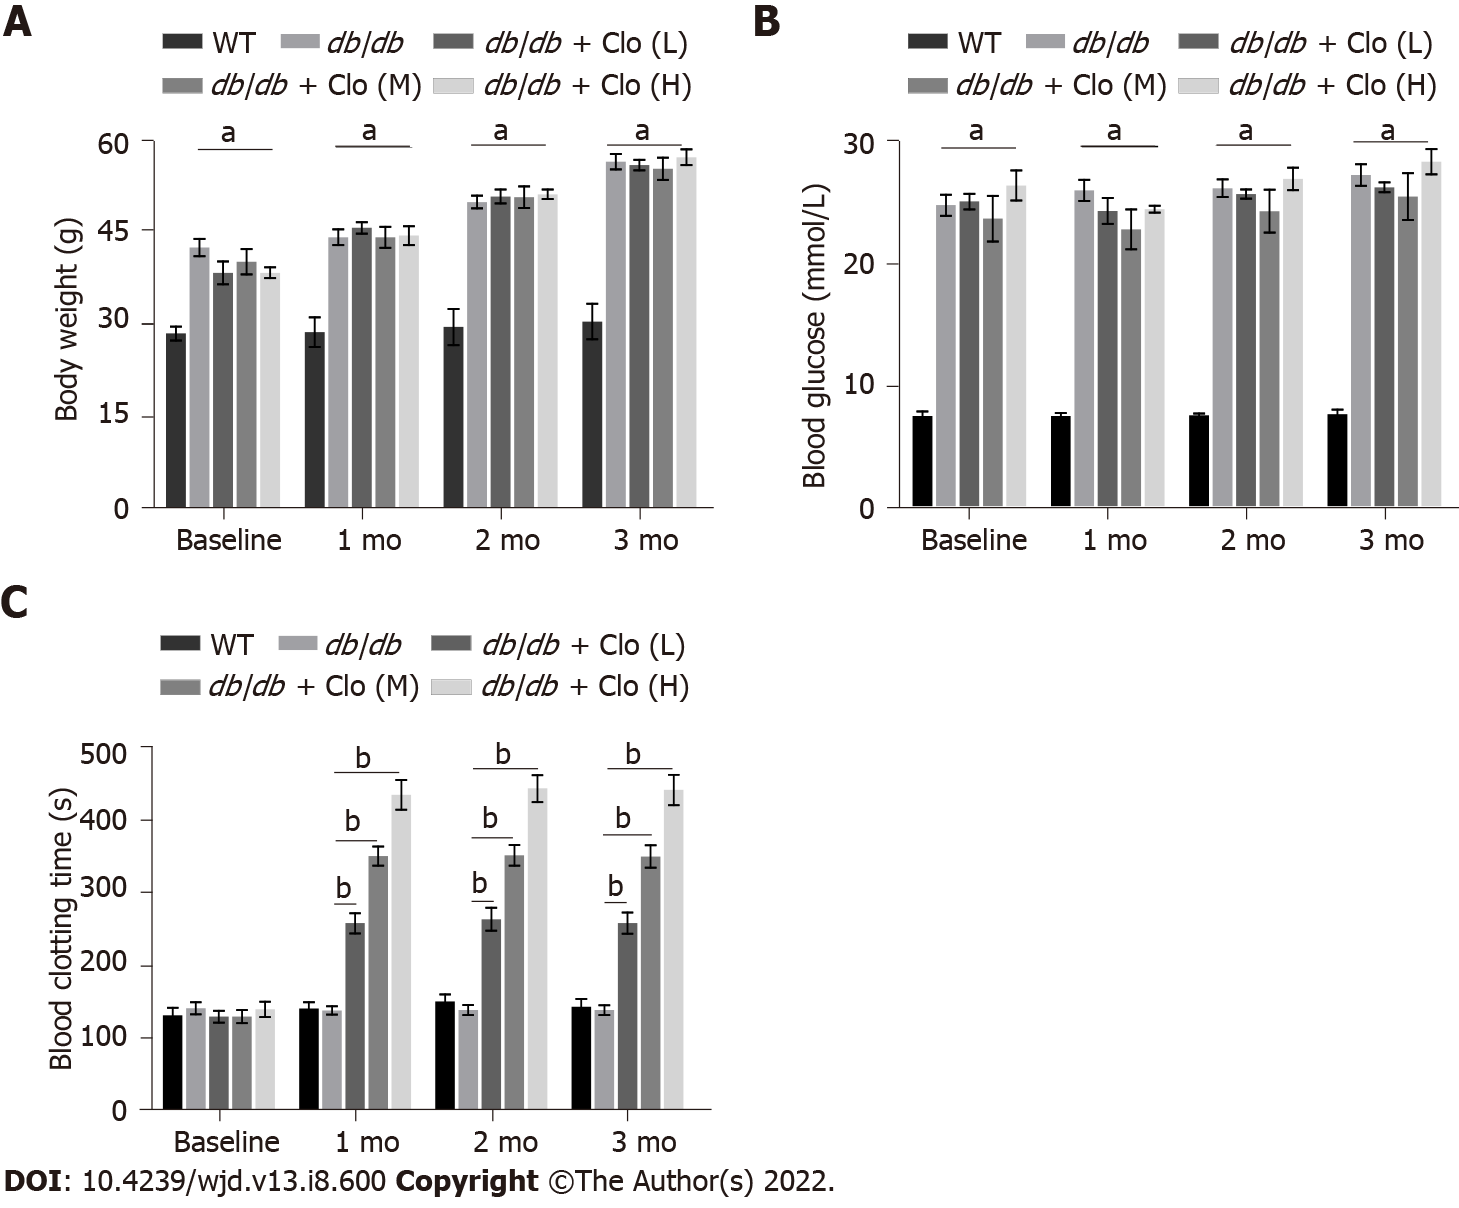
Figure 1 Effects of clopidogrel on body mass, 6-h fasting blood glucose level in mice, and the bleeding time of mice.
A: Body mass; B: Blood glucose; C: Blood clotting time. Data are shown as mean ± SD values of n = 6 mice per group. aP < 0.05 vs wild type mice. bP < 0.05 vs untreated db/db mice. WT: Wild type; db/db: db/db mice; Clo: Clopidogrel; Clo (L, M, H): Clopidogrel at 5, 10, or 20 mg/kg, respectively.
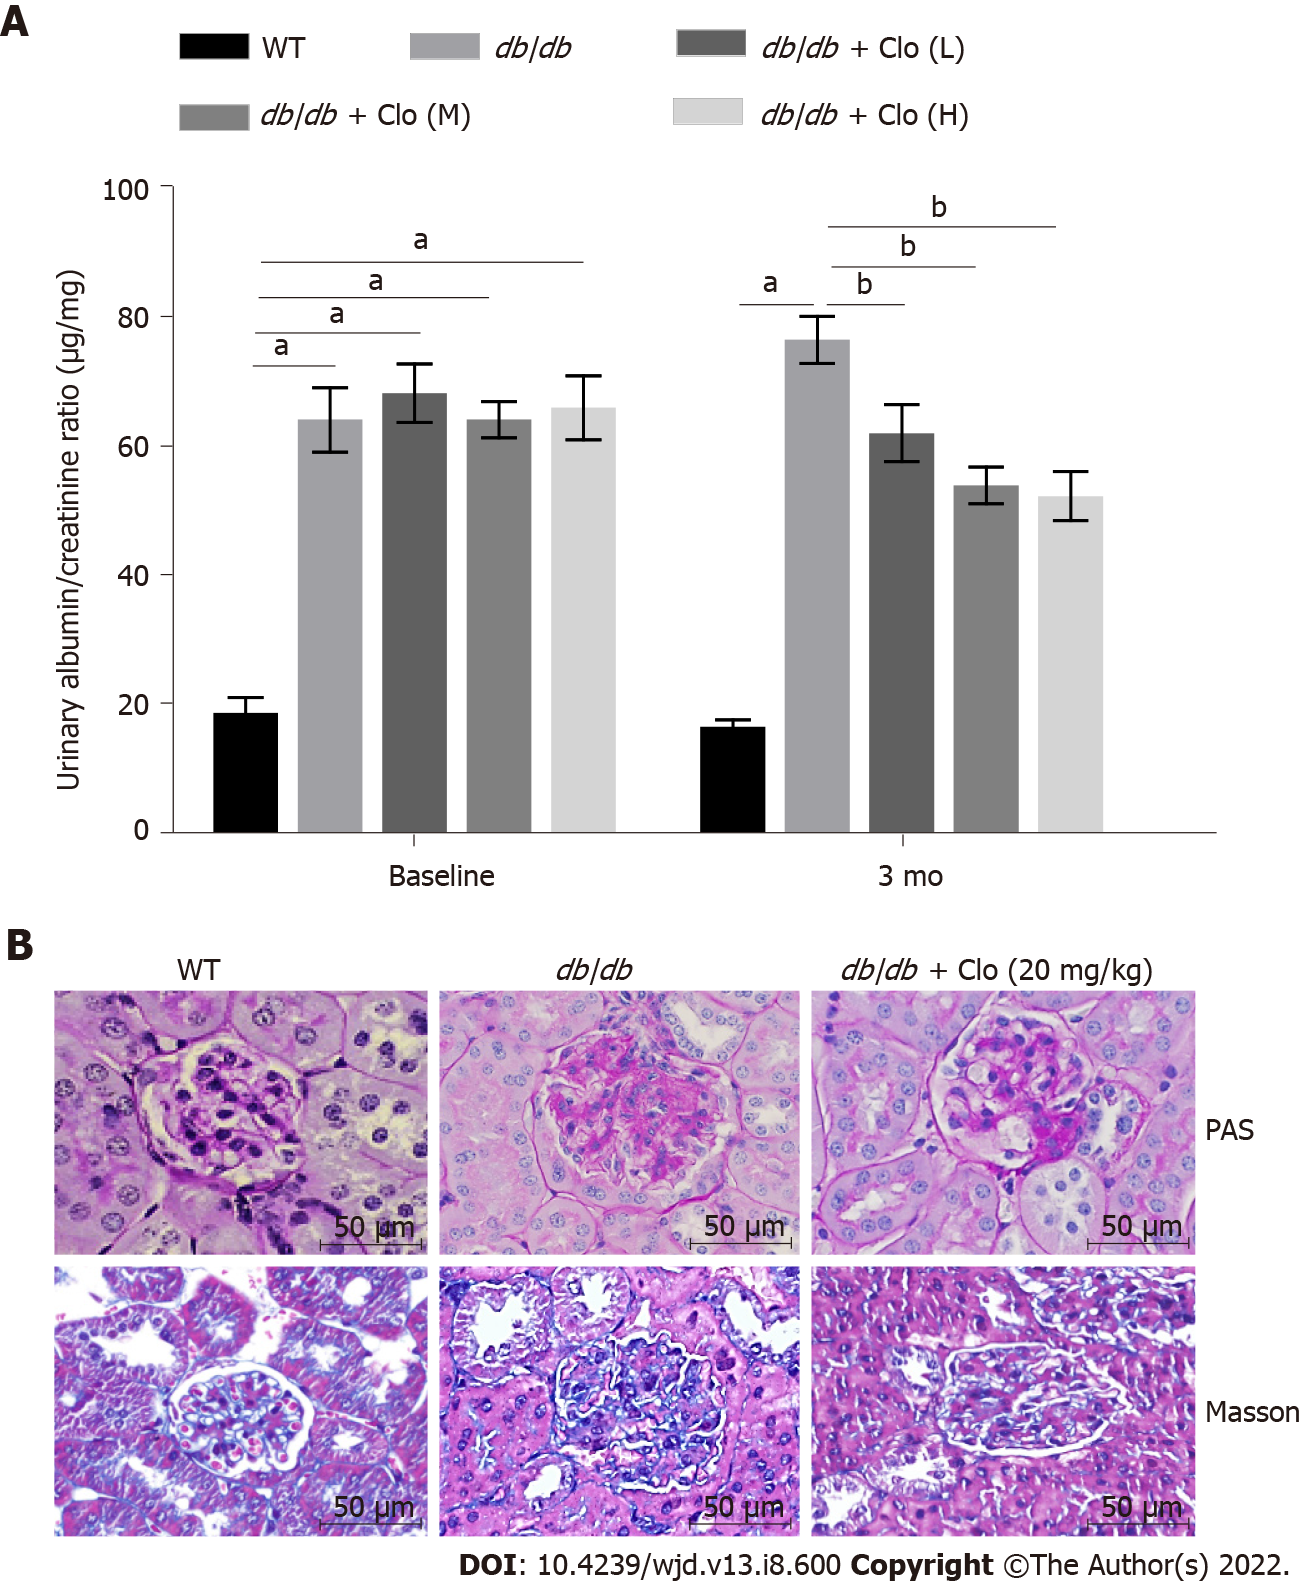
Figure 2 Clopidogrel improves the kidney function of db/db mice.
Data are shown as mean ± SD values of n = 6 mice per group. aP < 0.05 vs wild type mice; bP < 0.05 vs db/db mice. A: Urinary albumin/creatinine ratio. Mice at 12 wk of age were defined as the baseline; B: Periodic acid-Schiff staining of kidney sections for glycogen content and Masson’s trichrome staining for collagenous connective tissue fibers. Magnification: × 400. WT: Wild type; db/db: db/db mice; Clo: Clopidogrel; Clo (L, M, H): Clopidogrel at 5, 10, or 20 mg/kg, respectively.
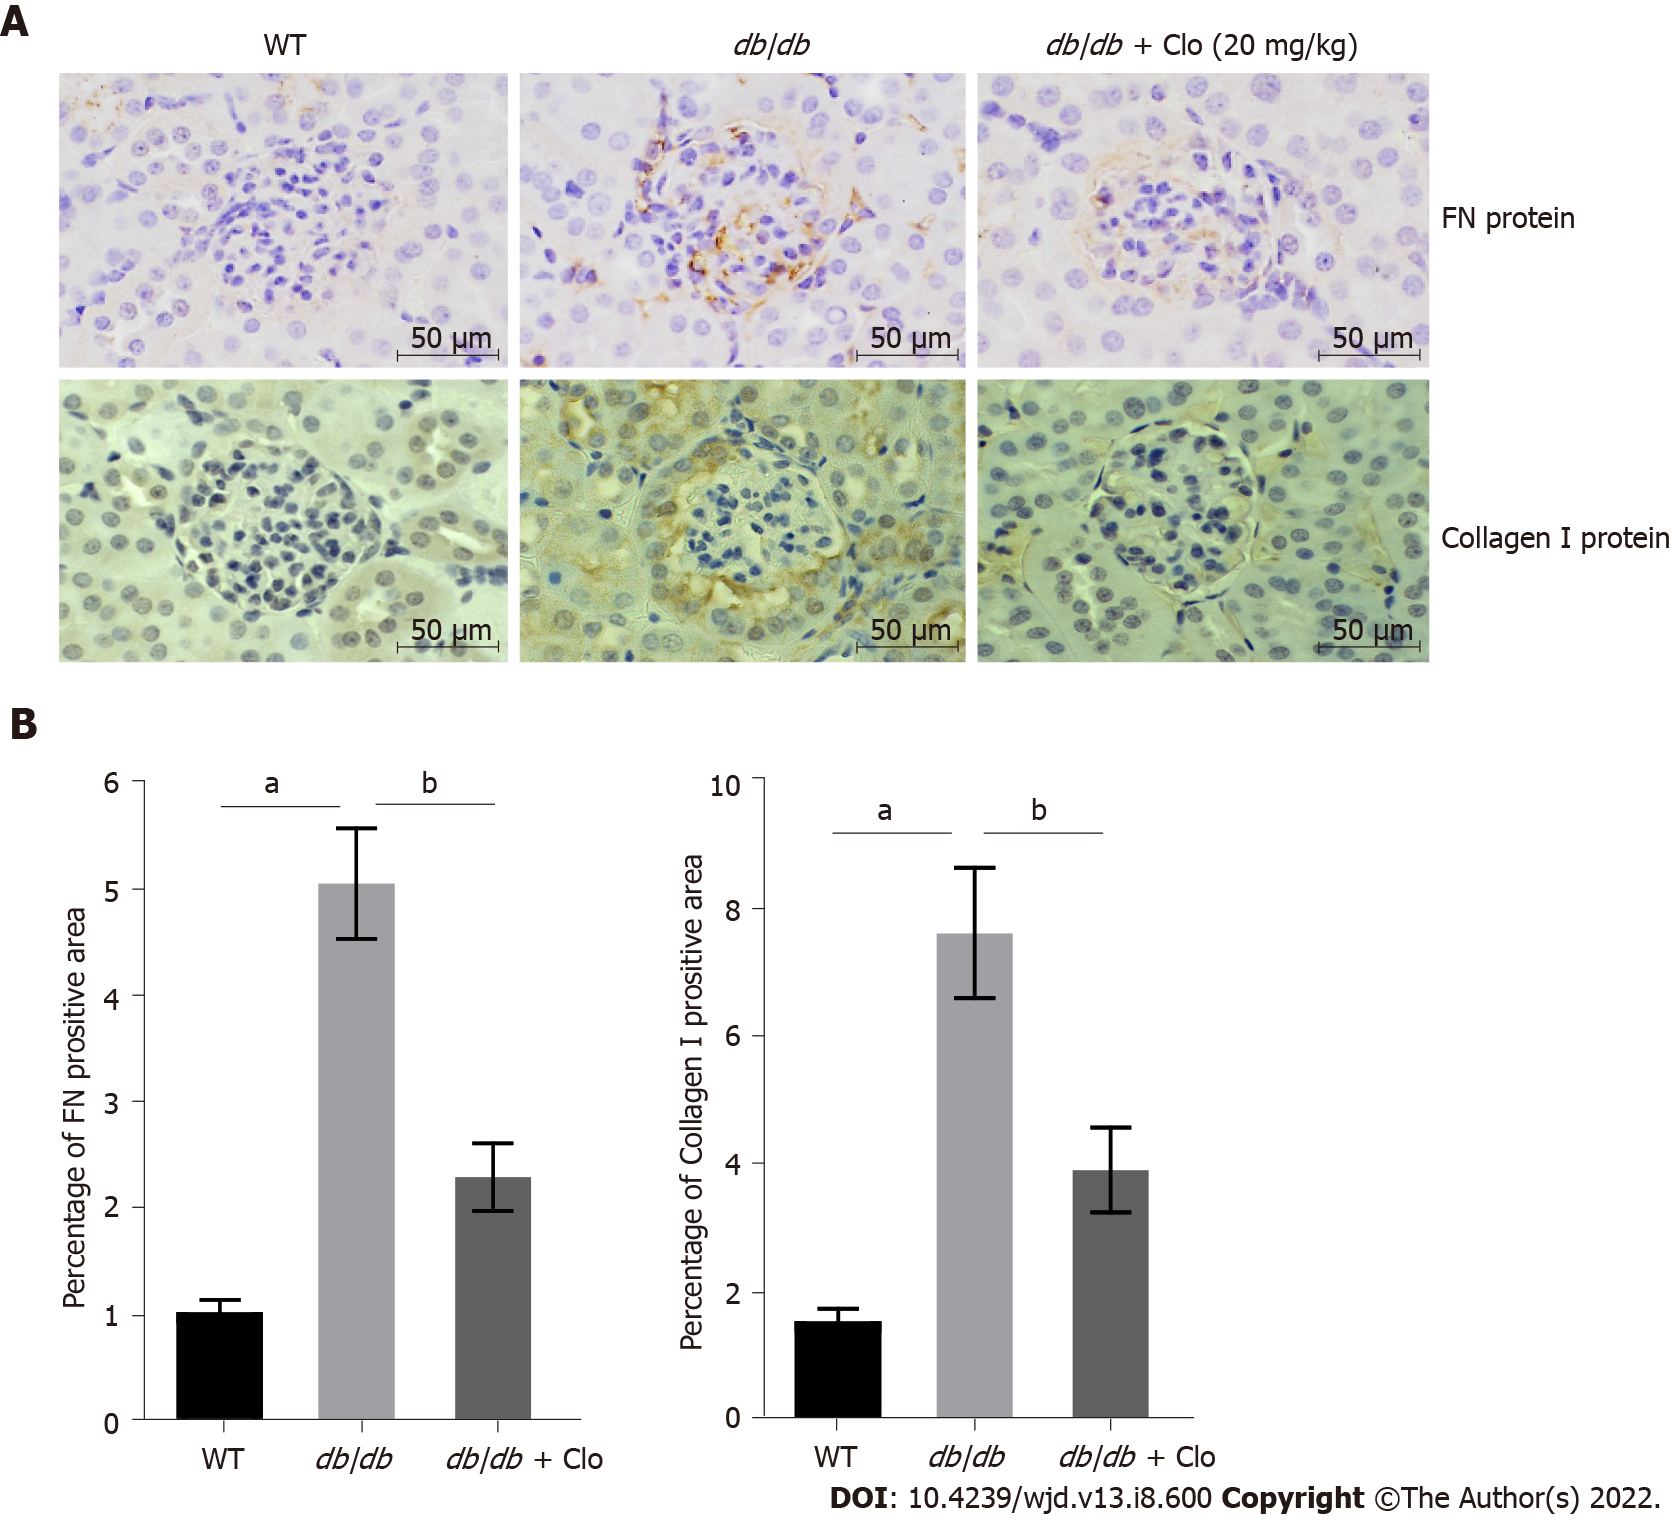
Figure 3 Clopidogrel reduces the production of fibronectin and collagen I in the kidneys of db/db mice.
A: Representative immunohistochemical staining. Magnification: × 400; B: Quantitative analysis of fibronectin protein and collagen I protein. Data are shown as mean ± SD values of n = 6 mice per group. aP < 0.05 vs wild type mice; bP < 0.05 vs db/db mice. FN: Fibronectin; WT: Wild type; db/db: db/db mice; Clo: Clopidogrel.
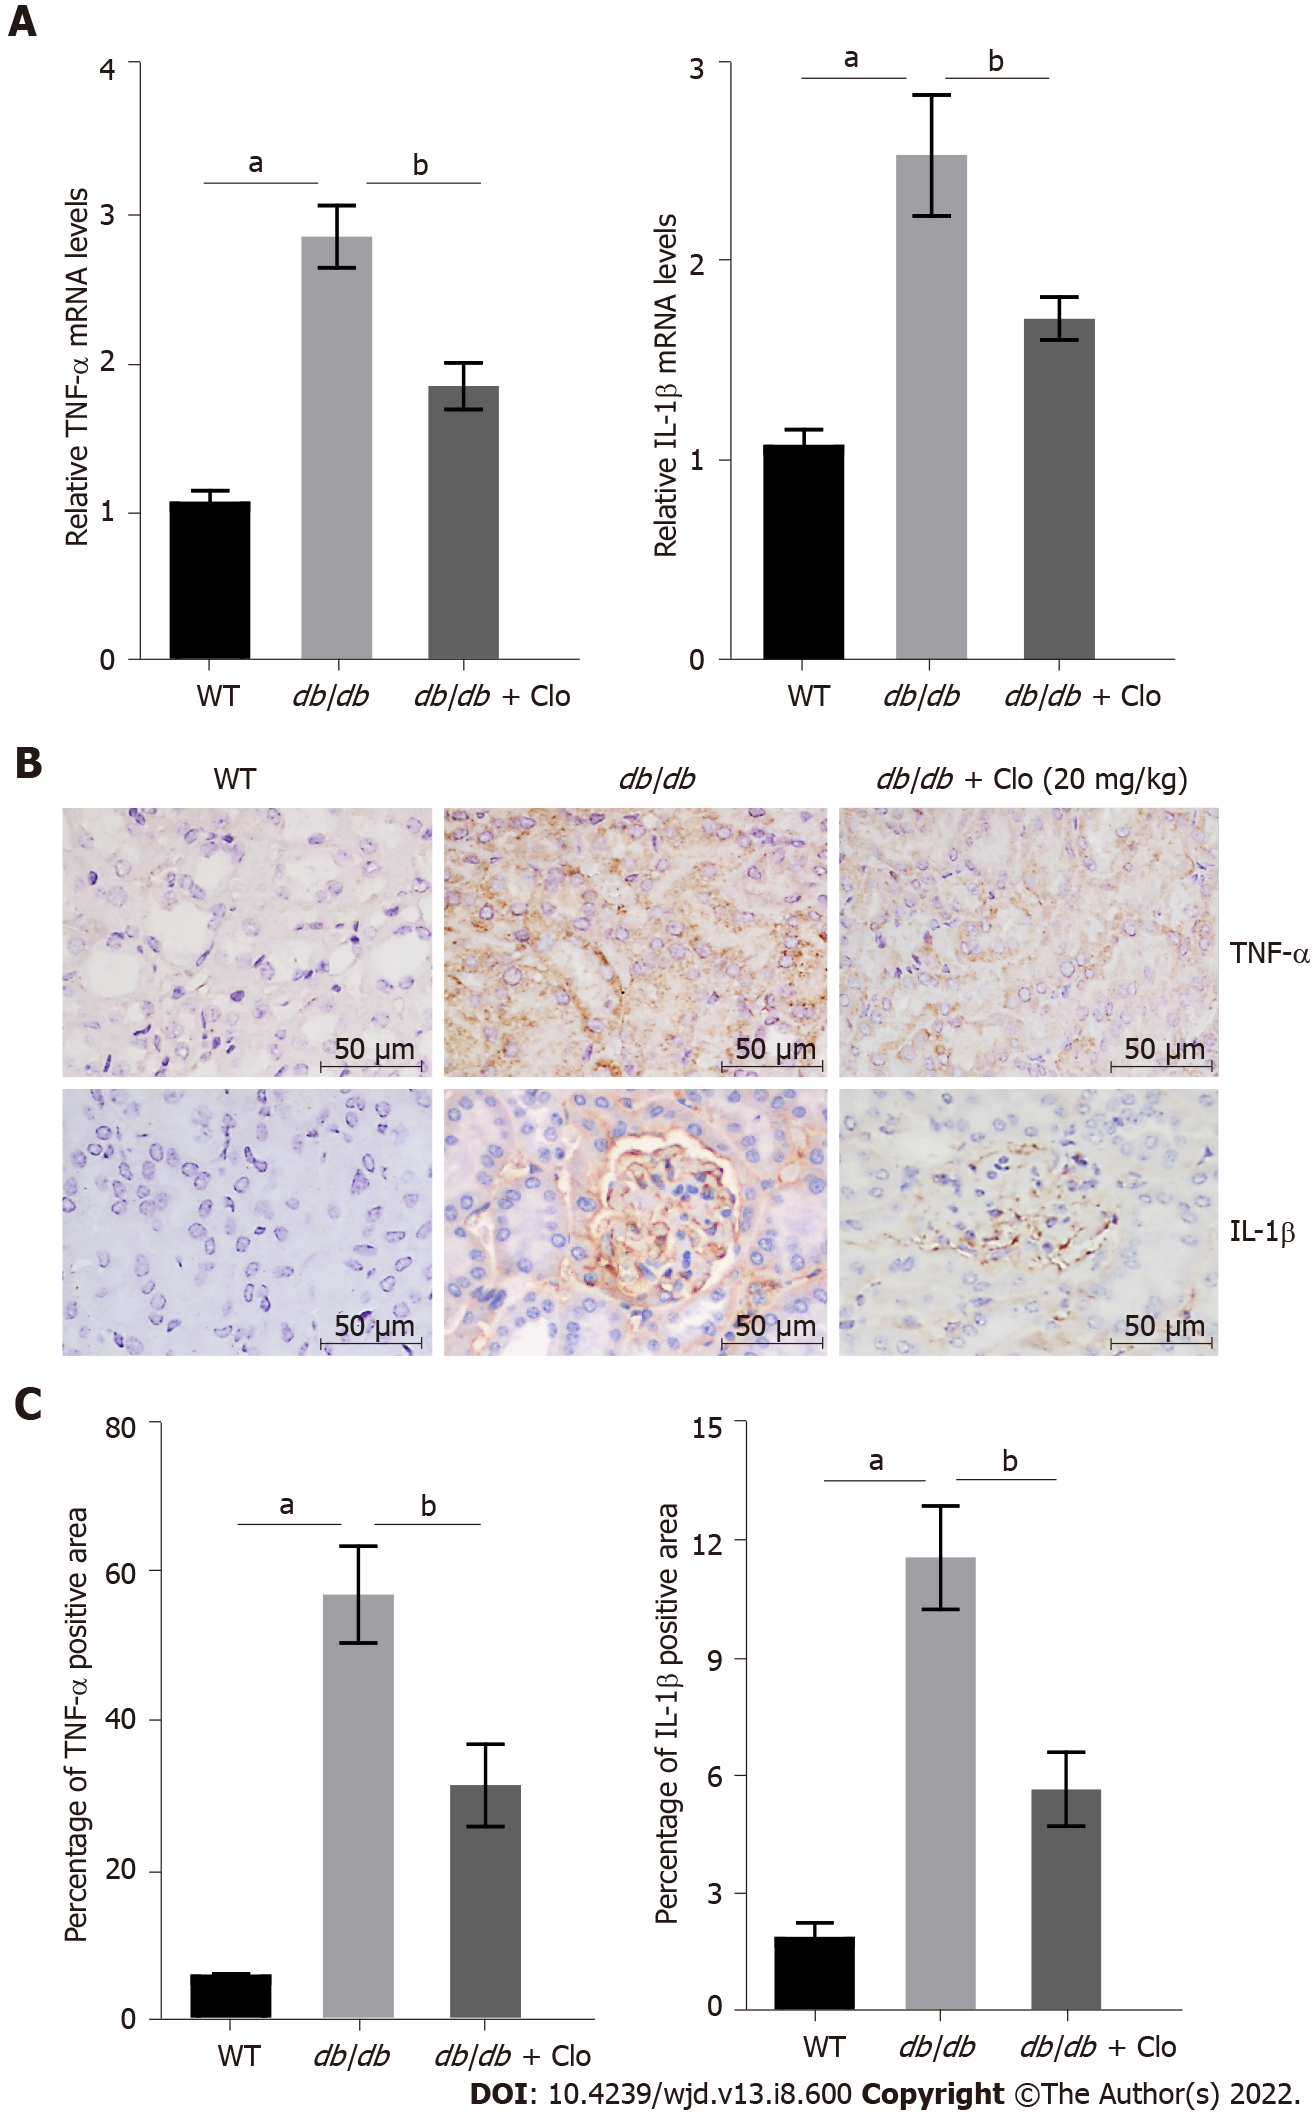
Figure 4 Clopidogrel inhibits the expression of tumor necrosis factor-α and interleukin-1β in db/db mice.
Data are shown as mean ± SD values of n = 6 per group. aP < 0.05 vs wild-type mice; bP < 0.05 vs db/db mice. A: Tumor necrosis factor (TNF)-α and interleukin (IL)-1β gene expression, determined using real-time polymerase chain reaction; B: Immunohistochemical staining; C: Semi-quantitative analysis of TNF-α and IL-1β protein expression. WT: Wild type; db/db: db/db mice; Clo: Clopidogrel; TNF: Tumor necrosis factor; IL: Interleukin.
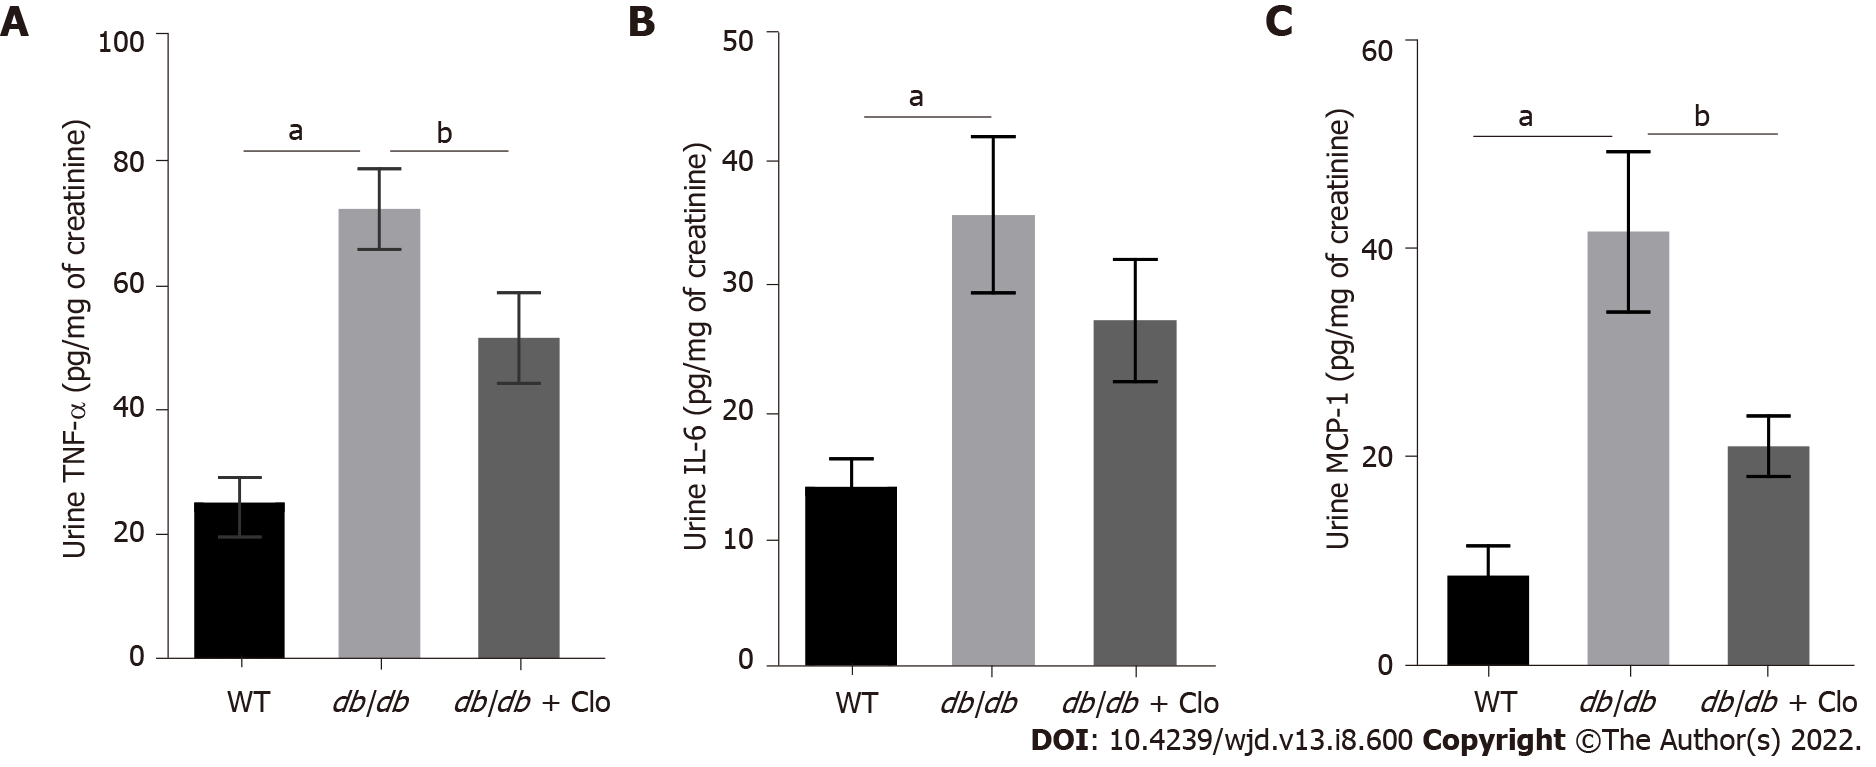
Figure 5 Clopidogrel reduces the levels of urinary tumor necrosis factor-α and monocyte chemoattractant protein-1 in db/db mice.
Data are shown as mean ± SD values of n = 6 mice per group. aP < 0.05 vs wild type mice; bP < 0.05 vs db/db mice. A: Tumor necrosis factor-α levels in the urine; B: Interleukin-6 levels in the urine; C: Monocyte chemoattractant protein-1 levels in the urine. WT: Wild type; db/db: db/db mice; Clo: Clopidogrel 20 mg/kg; TNF: Tumor necrosis factor; IL: Interleukin; MCP: Monocyte chemoattractant protein.
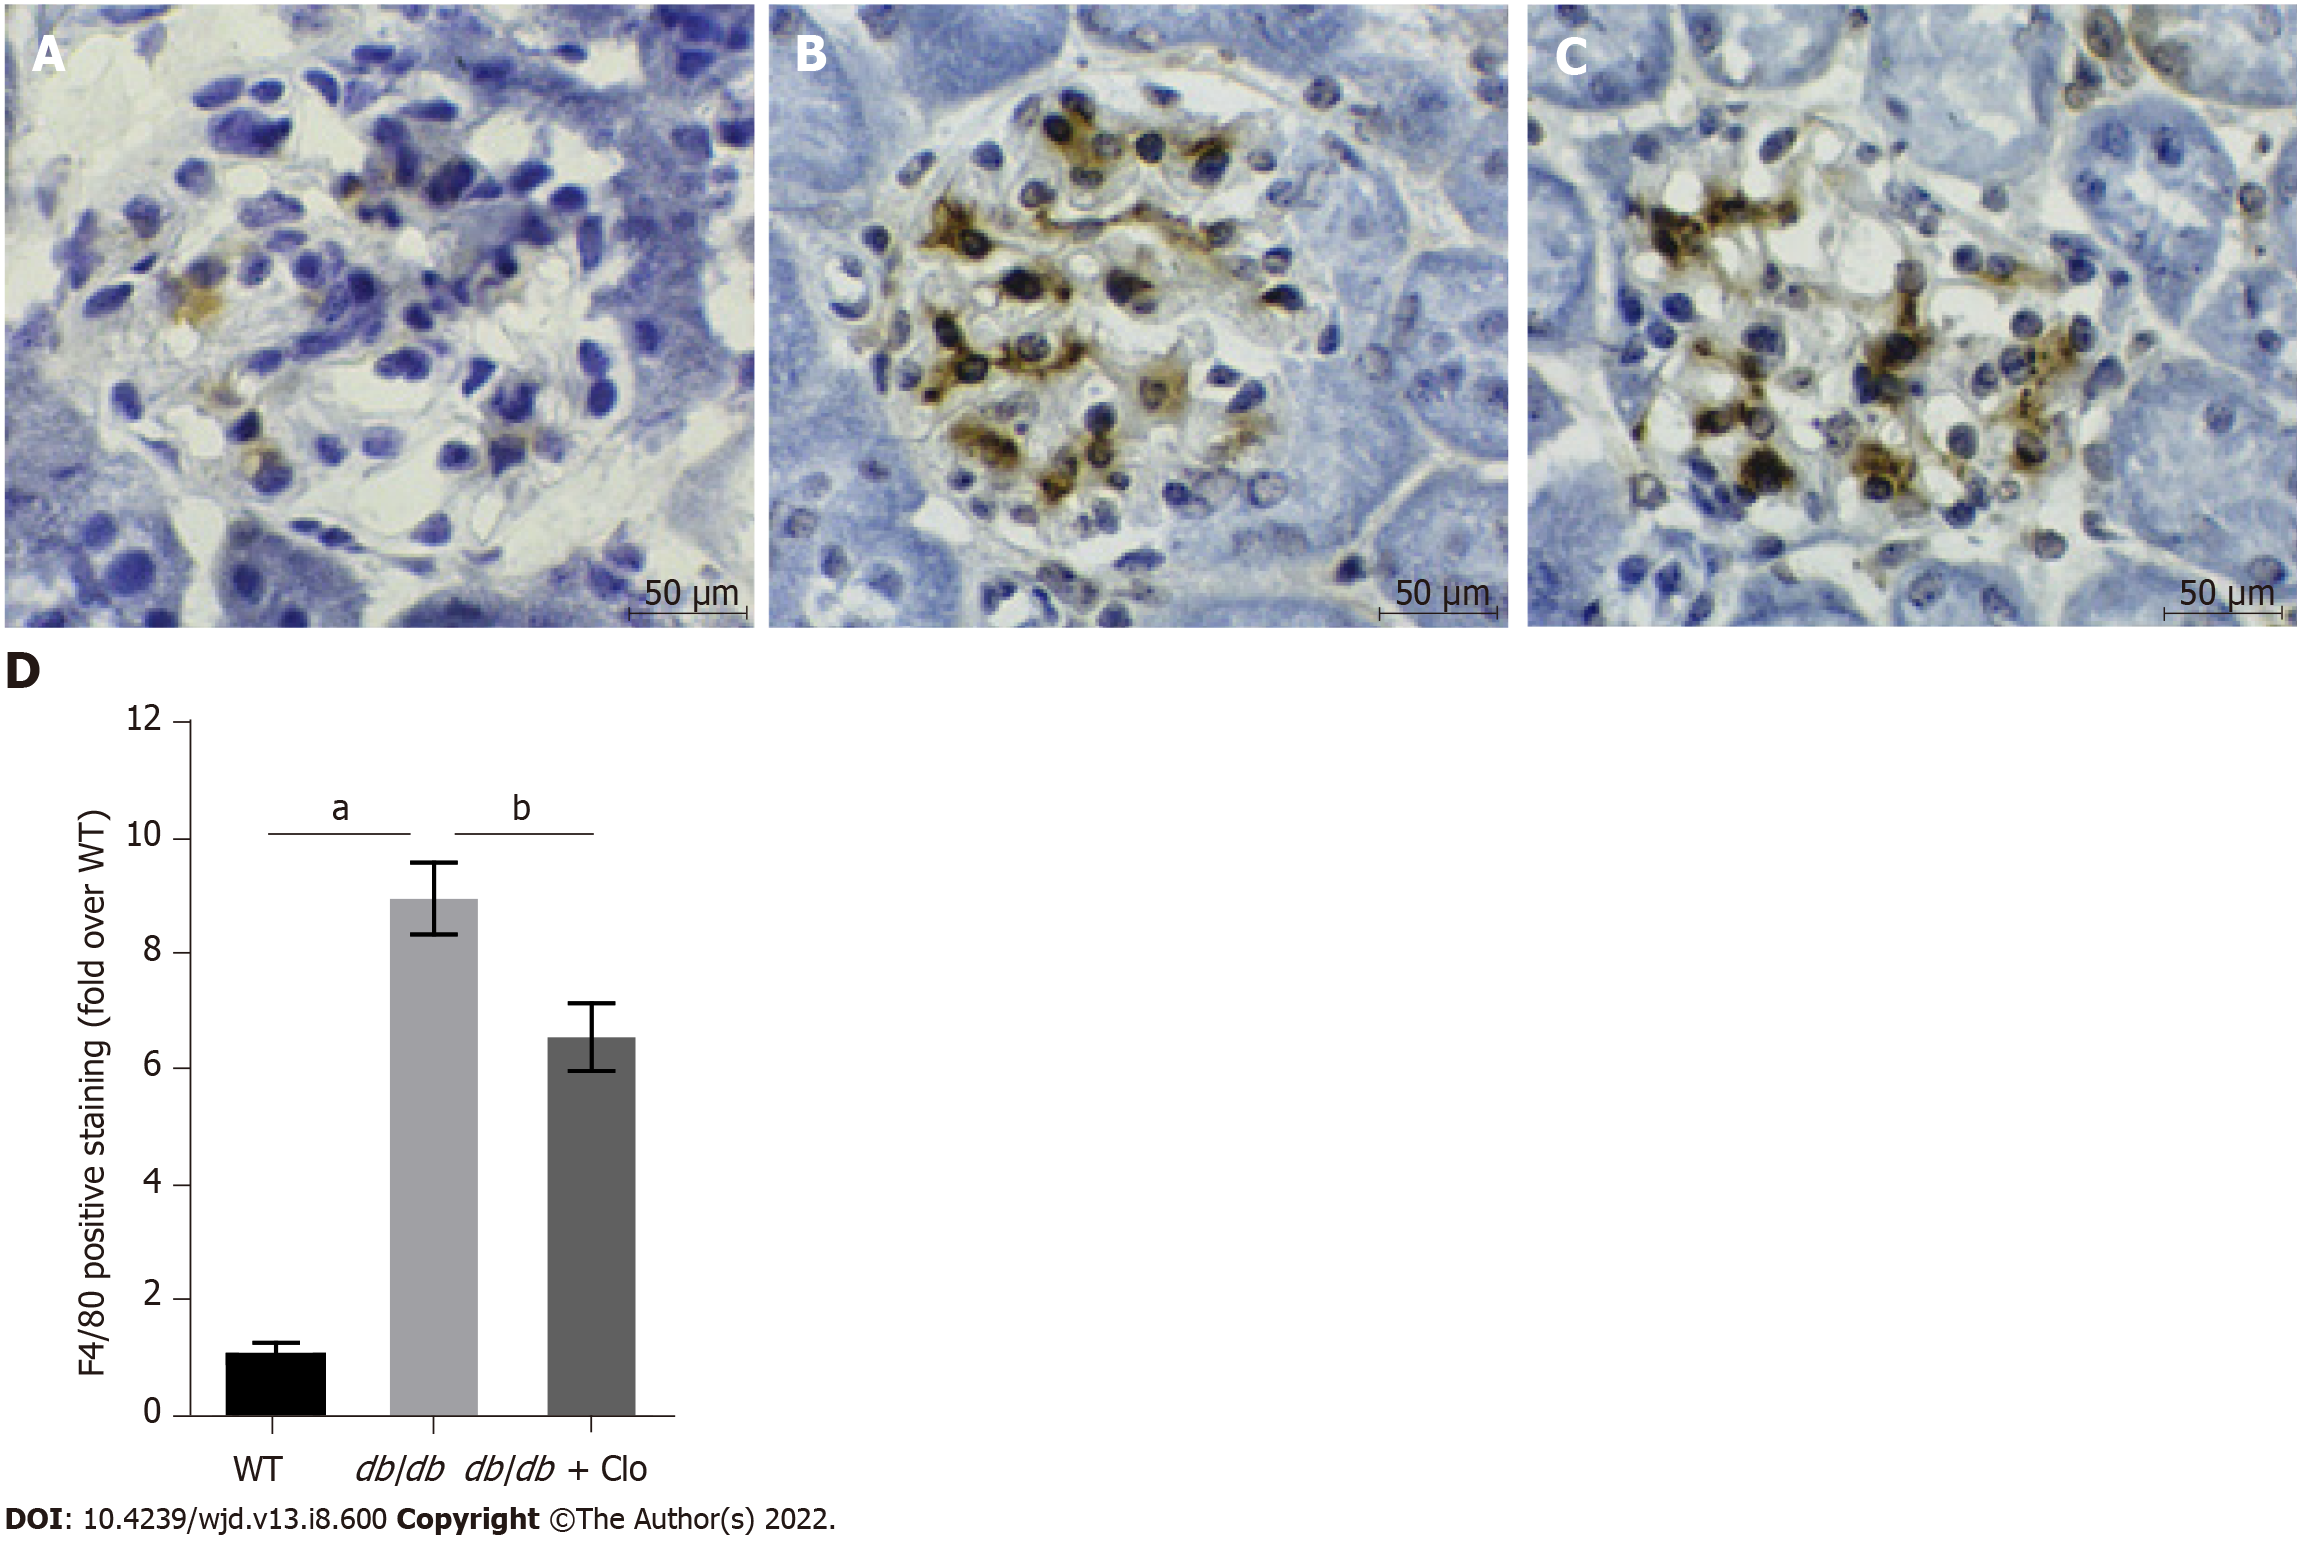
Figure 6 Clopidogrel reduces renal macrophage infiltration in db/db mice.
aP < 0.05 vs wild type mice; bP < 0.05 vs db/db mice. Immunohistochemical staining, magnification: × 400. A: Wild type; B: db/db mice; C: db/db + clopidogrel (20 mg/kg); D: Immunohistochemical analysis of F4/80 expression. WT: Wild type; db/db: db/db mice; Clo: Clopidogrel.
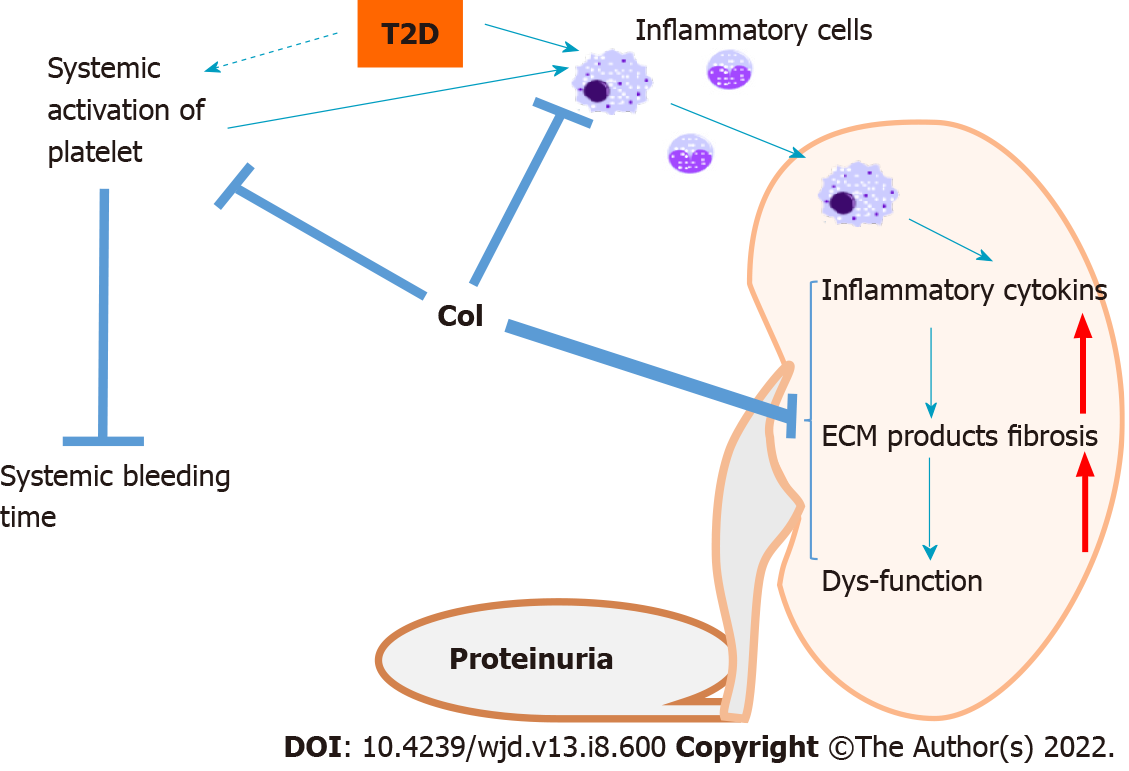
Figure 7 Outline of the potential mechanisms whereby clopidogrel ameliorates defects in renal structure and function in db/db mice.
Diabetes is associated with the activation of platelets, predisposing toward systemic thrombosis, which is reflected in a shorter bleeding time. Diabetes is also characterized by the activation of inflammatory cells, including macrophages, which infiltrate the kidney and release proinflammatory cytokines, causing systemic and renal inflammation, which is followed by renal damage, remodeling, and dysfunction. The treatment of db/db mice with clopidogrel may exert its effects in three main ways: (1) Direct inhibition of the infiltration of circulating inflammatory cells into the kidney; (2) Inactivation of activated platelets, preventing their promotion of inflammatory cell infiltration; and (3) Direct prevention of the diabetes-related renal inflammatory response and associated downstream pathways. The dashed arrow indicates that the systemic activation of platelet aggregation in diabetes requires further confirmation in longer-term studies of diabetes models. T2D: Type 2 diabetes; ECM: Extracellular matrix.
- Citation: Li HQ, Liu N, Zheng ZY, Teng HL, Pei J. Clopidogrel delays and can reverse diabetic nephropathy pathogenesis in type 2 diabetic db/db mice. World J Diabetes 2022; 13(8): 600-612
- URL: https://www.wjgnet.com/1948-9358/full/v13/i8/600.htm
- DOI: https://dx.doi.org/10.4239/wjd.v13.i8.600


