Copyright
©The Author(s) 2017.
World J Gastrointest Oncol. Mar 15, 2017; 9(3): 105-120
Published online Mar 15, 2017. doi: 10.4251/wjgo.v9.i3.105
Published online Mar 15, 2017. doi: 10.4251/wjgo.v9.i3.105
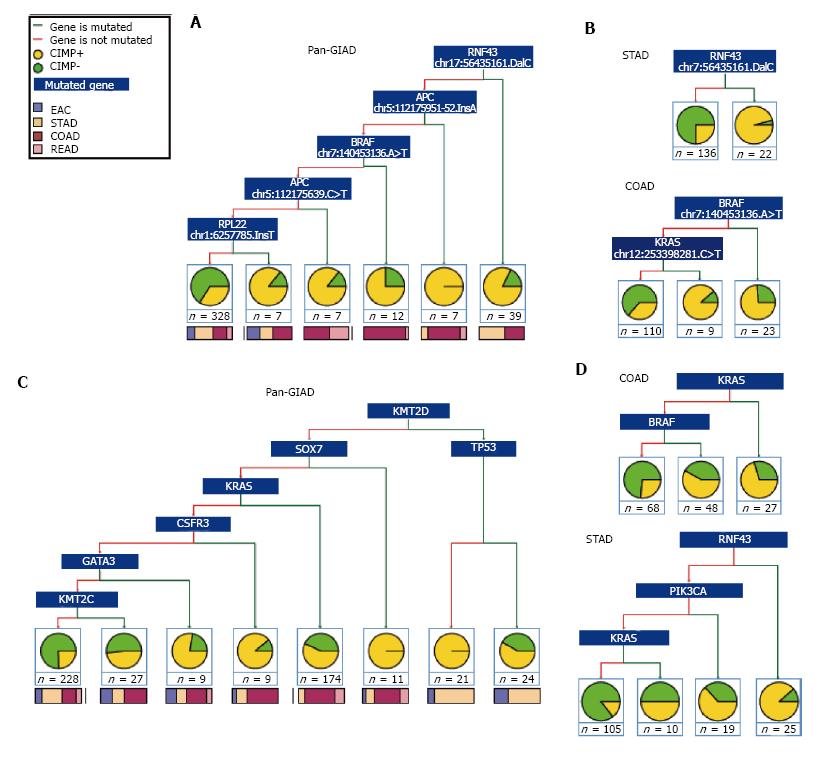
Figure 3 Binary decision trees for separating gastrointestinal adenocarcinomas into CpG island methylator phenotype categories.
Recursive partitioning of GIADs from TCGA using binary classification trees based on CIMP status and mutational profiles. Results are provided for A: The combined GIAD data set at the individual mutation level; B: The STAD and COAD data sets at the individual mutation level; C: The combined GIAD data set at the mutated gene level; D: The STAD and COAD data sets at the mutated gene level. Red and green branches illustrate whether a specific mutation is present or absent (or whether a given gene is mutated or not) in the corresponding subset of tumors. Terminal nodes show the number of samples and the associated CIMP+ vs CIMP- fractions, as well as the proportion of different cancer types represented in each subset. GIADs: Gastrointestinal adenocarcinomas; TCGA: The Cancer Genome Atlas; CIMP: CpG island methylator phenotype.
- Citation: Sánchez-Vega F, Gotea V, Chen YC, Elnitski L. CpG island methylator phenotype in adenocarcinomas from the digestive tract: Methods, conclusions, and controversies. World J Gastrointest Oncol 2017; 9(3): 105-120
- URL: https://www.wjgnet.com/1948-5204/full/v9/i3/105.htm
- DOI: https://dx.doi.org/10.4251/wjgo.v9.i3.105


