Copyright
©The Author(s) 2017.
World J Gastrointest Oncol. Mar 15, 2017; 9(3): 105-120
Published online Mar 15, 2017. doi: 10.4251/wjgo.v9.i3.105
Published online Mar 15, 2017. doi: 10.4251/wjgo.v9.i3.105
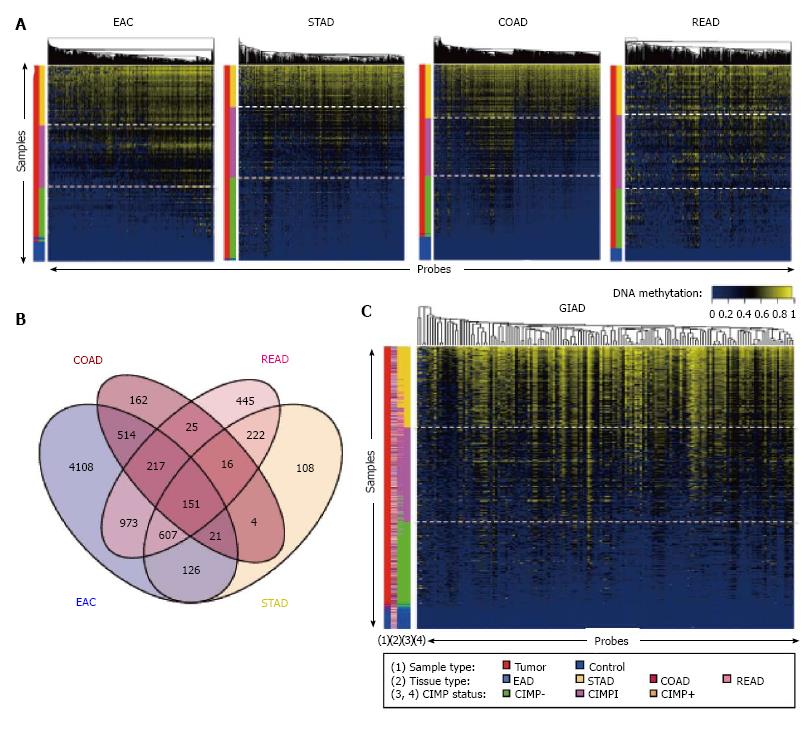
Figure 1 CpG island methylator phenotype analysis of gastrointestinal adenocarcinoma samples from the Cancer Genome Atlas.
A: CIMP analysis for EAC, STAD, COAD, and READ samples. Each row represents a sample, and each column represents a probe. The two-color side bar shows tumor samples (red) and normal samples (blue). The four-color side bar indicates CIMP status: CIMP+ (gold), CIMP intermediate (CIMPi; magenta), CIMP- (green), and normal (blue). Samples were ranked vertically according to mean methylation levels across all of the probes shown in the heat map; B: Venn diagram showing the intersection of the selected, informative probes with regard to CIMP status across the four cancer types; C: CIMP analysis for the combined GIAD data set, in which samples from the four individual tumor types were pooled together. The side bars show (1) sample type (tumor vs adjacent tissue); (2) cancer type (EAC, STAD, COAD, or READ); (3) CIMP status based on the individual analyses shown in panel A; and (4) CIMP status based on the analysis using the pooled data set. CIMP: CpG island methylator phenotype; EAC: Esophageal adenocarcinoma; STAD: Stomach adenocarcinoma; COAD: Colon adenocarcinoma; READ: Rectal adenocarcinoma; GIAD: Gastrointestinal adenocarcinoma.
- Citation: Sánchez-Vega F, Gotea V, Chen YC, Elnitski L. CpG island methylator phenotype in adenocarcinomas from the digestive tract: Methods, conclusions, and controversies. World J Gastrointest Oncol 2017; 9(3): 105-120
- URL: https://www.wjgnet.com/1948-5204/full/v9/i3/105.htm
- DOI: https://dx.doi.org/10.4251/wjgo.v9.i3.105


