Copyright
©2014 Baishideng Publishing Group Inc.
World J Gastrointest Oncol. Aug 15, 2014; 6(8): 289-300
Published online Aug 15, 2014. doi: 10.4251/wjgo.v6.i8.289
Published online Aug 15, 2014. doi: 10.4251/wjgo.v6.i8.289
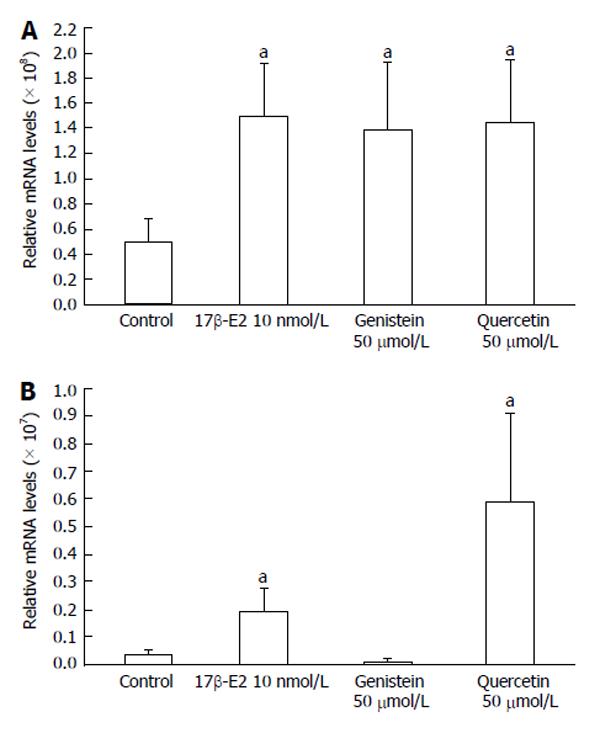
Figure 8 Expression of ERβ mRNA levels by quantitative real-time reverse transcription-polymerase chain reaction.
Induction of ERβ expression by 17β-E2, genistein and quercetin in A: HCT8-β8-expressing cells; B: HCT8-pSV2neo-expressing cells. The results are expressed relative to RPS18 mRNA levels. Values are the mean ± SD of quadruplicates; aP < 0.05 vs control.
-
Citation: Pampaloni B, Palmini G, Mavilia C, Zonefrati R, Tanini A, Brandi ML.
In vitro effects of polyphenols on colorectal cancer cells. World J Gastrointest Oncol 2014; 6(8): 289-300 - URL: https://www.wjgnet.com/1948-5204/full/v6/i8/289.htm
- DOI: https://dx.doi.org/10.4251/wjgo.v6.i8.289


