Copyright
©2014 Baishideng Publishing Group Inc.
World J Gastrointest Oncol. Jul 15, 2014; 6(7): 225-243
Published online Jul 15, 2014. doi: 10.4251/wjgo.v6.i7.225
Published online Jul 15, 2014. doi: 10.4251/wjgo.v6.i7.225
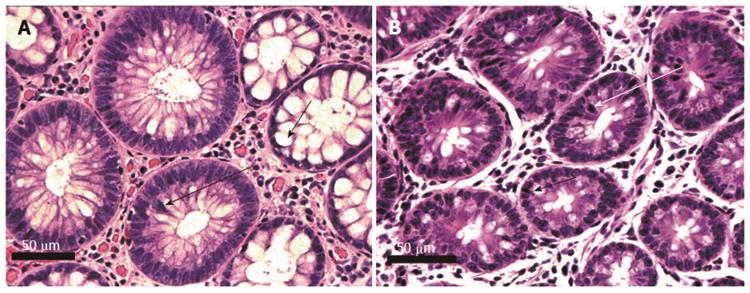
Figure 6 Human (A) and mouse (B) crypts cut across the short axis, showing tubular adenomatous crypts as well as histologically normal crypts.
Crypts on the right in A and at the bottom of B have normal histology. Adenomatous crypts are seen to the left in A, and in the top half of B. Adenomatous glands show overlapping cells with hyperchromatic mitotically active nuclei (long arrows indicate examples of cells undergoing mitosis). Short arrows indicate typical goblet cells. The goblet cells in adenomatous glands are decreased in frequency compared to goblet cells in the histologically normal glands. Images obtained with 40× objective lens.
- Citation: Prasad AR, Prasad S, Nguyen H, Facista A, Lewis C, Zaitlin B, Bernstein H, Bernstein C. Novel diet-related mouse model of colon cancer parallels human colon cancer. World J Gastrointest Oncol 2014; 6(7): 225-243
- URL: https://www.wjgnet.com/1948-5204/full/v6/i7/225.htm
- DOI: https://dx.doi.org/10.4251/wjgo.v6.i7.225


