Copyright
©2014 Baishideng Publishing Group Co.
World J Gastrointest Oncol. Jan 15, 2014; 6(1): 22-33
Published online Jan 15, 2014. doi: 10.4251/wjgo.v6.i1.22
Published online Jan 15, 2014. doi: 10.4251/wjgo.v6.i1.22
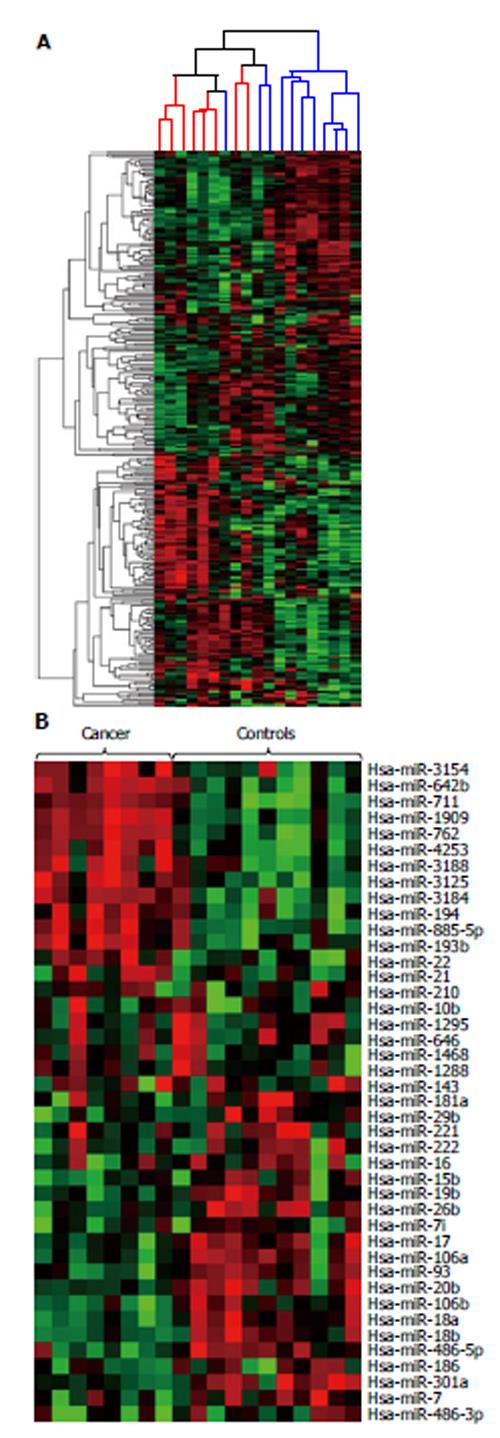
Figure 1 The microarray signature profile of circulating microRNA in pancreatic cancer patients and healthy controls.
A: The unsupervised hierarchical clustering of 290 miRNAs that are differentially expressed among pancreatic cancer patients (n = 8) and healthy controls (n = 11). The dendrogram on top indicates the hierarchical clustering relationship between pancreatic cancer patients (in red) and healthy controls (in blue); B: Heat map depicting the subset of 42 miRNAs chosen for confirmation RT-qPCR study, arranged as indicated. Heat map color scale represents fold increase (red) or decrease (green) from baseline. MiRNA: MicroRNA.
- Citation: Ganepola GA, Rutledge JR, Suman P, Yiengpruksawan A, Chang DH. Novel blood-based microRNA biomarker panel for early diagnosis of pancreatic cancer. World J Gastrointest Oncol 2014; 6(1): 22-33
- URL: https://www.wjgnet.com/1948-5204/full/v6/i1/22.htm
- DOI: https://dx.doi.org/10.4251/wjgo.v6.i1.22


