Copyright
©2013 Baishideng Publishing Group Co.
World J Gastrointest Oncol. Oct 15, 2012; 4(10): 207-215
Published online Oct 15, 2012. doi: 10.4251/wjgo.v4.i10.207
Published online Oct 15, 2012. doi: 10.4251/wjgo.v4.i10.207
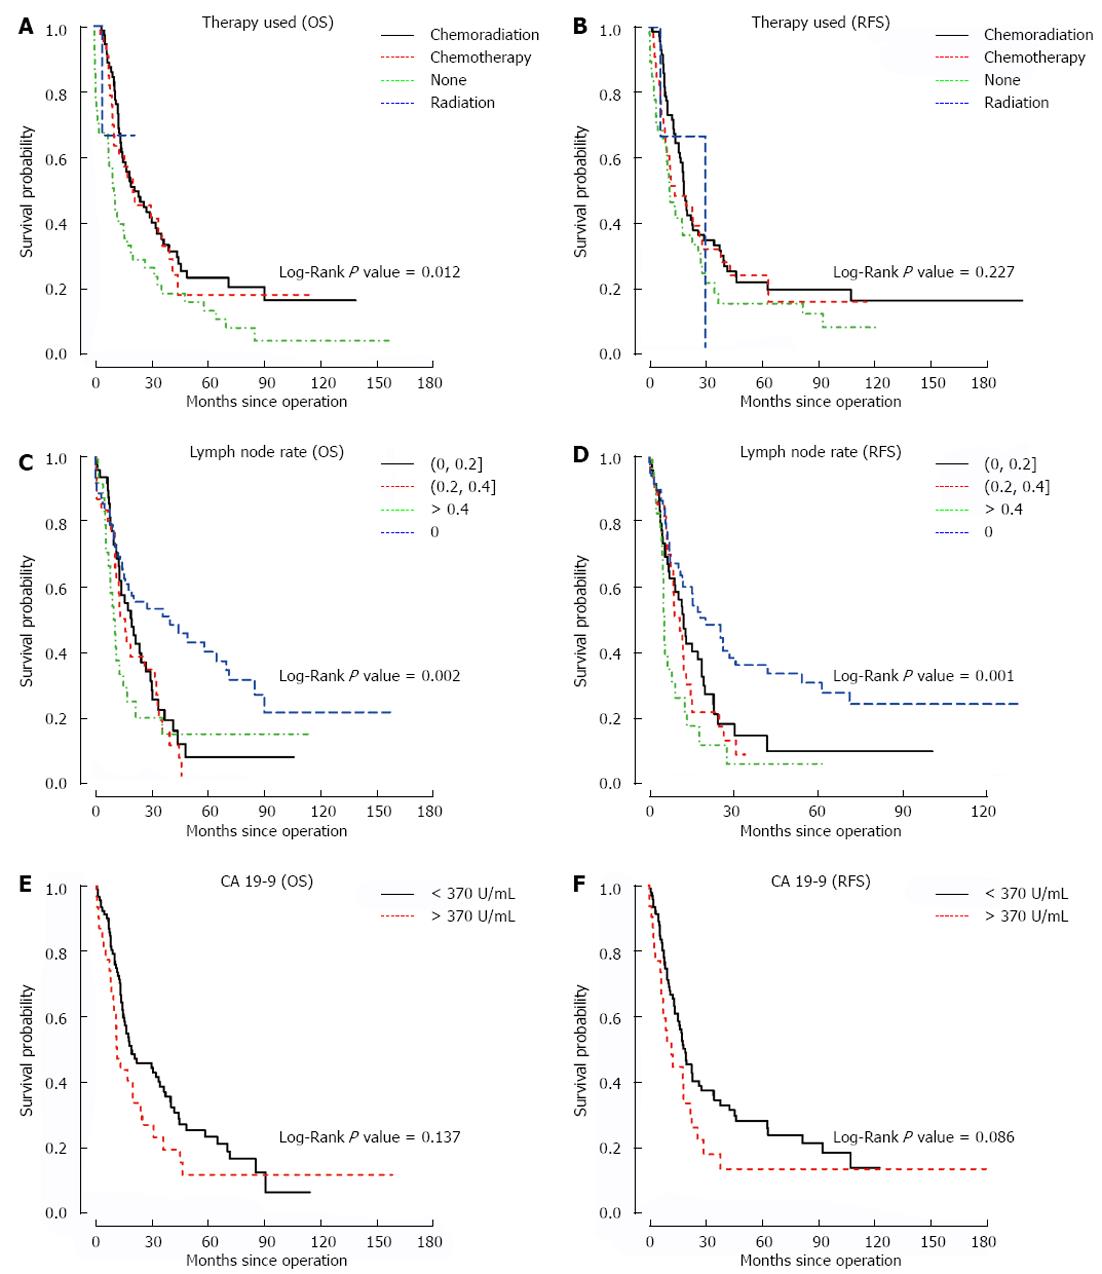
Figure 1 Kaplan-Meier curves.
A, B: Univariate analysis Kaplan-Meier curve of adjuvant therapy demonstrates improvements in overall survival (OS) (P = 0.012), but not recurrence-free survival (RFS). The protective effect of adjuvant therapy was lost on multivariate analysis (n = 169); C, D: Univariate analysis Kaplan-Meier curves of lymph node ratio using an arbitrary stratification (0, < 0.2, 0.2-0.4 and > 0.4) shows significant improvements in OS (P = 0.002) and RFS (P = 0.001) (n = 169); E, F: Multivariate analysis Kaplan-Meier curves of peroperative carbohydrate antigen (CA) 19-9 levels using an arbitrary cutoff of 370 U/mL demonstrate no correlation with OS (P = 0.137) and marginal improvement in RFS (P = 0.086) (n = 124).
- Citation: Wentz SC, Zhao ZG, Shyr Y, Shi CJ, Merchant NB, Washington K, Xia F, Chakravarthy AB. Lymph node ratio and preoperative CA 19-9 levels predict overall survival and recurrence-free survival in patients with resected pancreatic adenocarcinoma. World J Gastrointest Oncol 2012; 4(10): 207-215
- URL: https://www.wjgnet.com/1948-5204/full/v4/i10/207.htm
- DOI: https://dx.doi.org/10.4251/wjgo.v4.i10.207


