Copyright
©2010 Baishideng.
World J Gastrointest Oncol. Apr 15, 2010; 2(4): 197-204
Published online Apr 15, 2010. doi: 10.4251/wjgo.v2.i4.197
Published online Apr 15, 2010. doi: 10.4251/wjgo.v2.i4.197
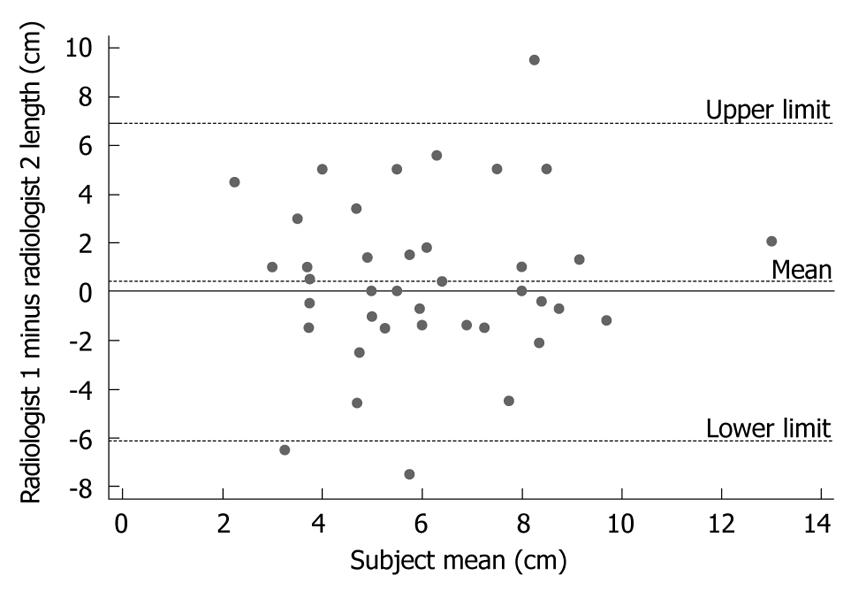
Figure 2 Bland-Altman plot for inter-observer variability of the radiologists.
The limits of agreement between the radiologists range from -6.10-6.95 cm with a mean difference (95% CI) of 0.39 (-0.59 to 1.44); Indicating weak agreement between the independent measurements.
- Citation: Sillah K, Williams LR, Laasch HU, Saleem A, Watkins G, Pritchard SA, Price PM, West CM, Welch IM. Computed tomography overestimation of esophageal tumor length: Implications for radiotherapy planning. World J Gastrointest Oncol 2010; 2(4): 197-204
- URL: https://www.wjgnet.com/1948-5204/full/v2/i4/197.htm
- DOI: https://dx.doi.org/10.4251/wjgo.v2.i4.197


