Copyright
©2010 Baishideng.
World J Gastrointest Oncol. Feb 15, 2010; 2(2): 76-84
Published online Feb 15, 2010. doi: 10.4251/wjgo.v2.i2.76
Published online Feb 15, 2010. doi: 10.4251/wjgo.v2.i2.76
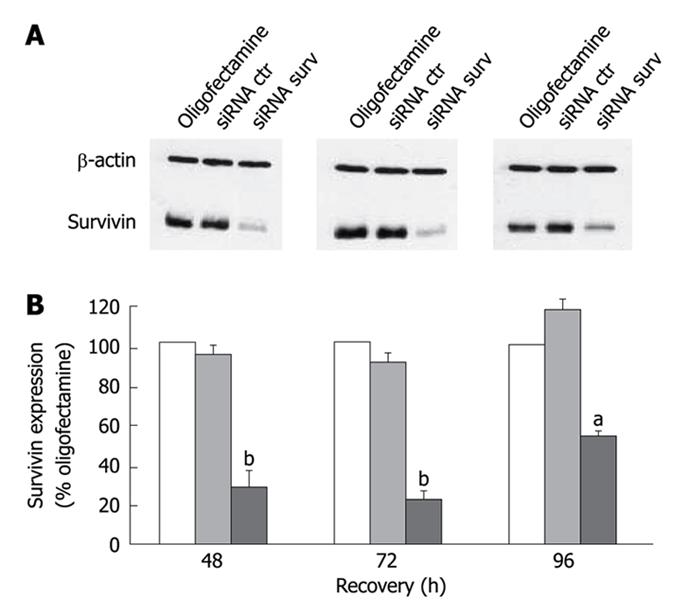
Figure 2 Representative Western blotting experiments illustrating survivin expression in STO cells exposed to oligofectamine alone or transfected with control siRNA and survivin siRNA.
A: β-actin was used as a control for protein loading; B: Densitometric quantification of survivin band intensities in oligofectamine-exposed cells (empty column) and cells transfected with the control siRNA (gray column) or the survivin siRNA (black column). Data represent mean ± SD of 3 independent experiments. aP < 0.02; bP < 0.01; Student’s t test; such inhibition was highest (around 80%; P < 0.01) at 48 h and 72 h after transfection and still appreciable, although to a lesser extent (around 50%; P < 0.02), at 96 h.
- Citation: Deraco M, Baratti D, Cabras AD, Zaffaroni N, Perrone F, Villa R, Jocollè J, Balestra MR, Kusamura S, Laterza B, Pilotti S. Experience with peritoneal mesothelioma at the Milan National Cancer Institute. World J Gastrointest Oncol 2010; 2(2): 76-84
- URL: https://www.wjgnet.com/1948-5204/full/v2/i2/76.htm
- DOI: https://dx.doi.org/10.4251/wjgo.v2.i2.76


