Copyright
©The Author(s) 2025.
World J Gastrointest Oncol. Apr 15, 2025; 17(4): 103843
Published online Apr 15, 2025. doi: 10.4251/wjgo.v17.i4.103843
Published online Apr 15, 2025. doi: 10.4251/wjgo.v17.i4.103843
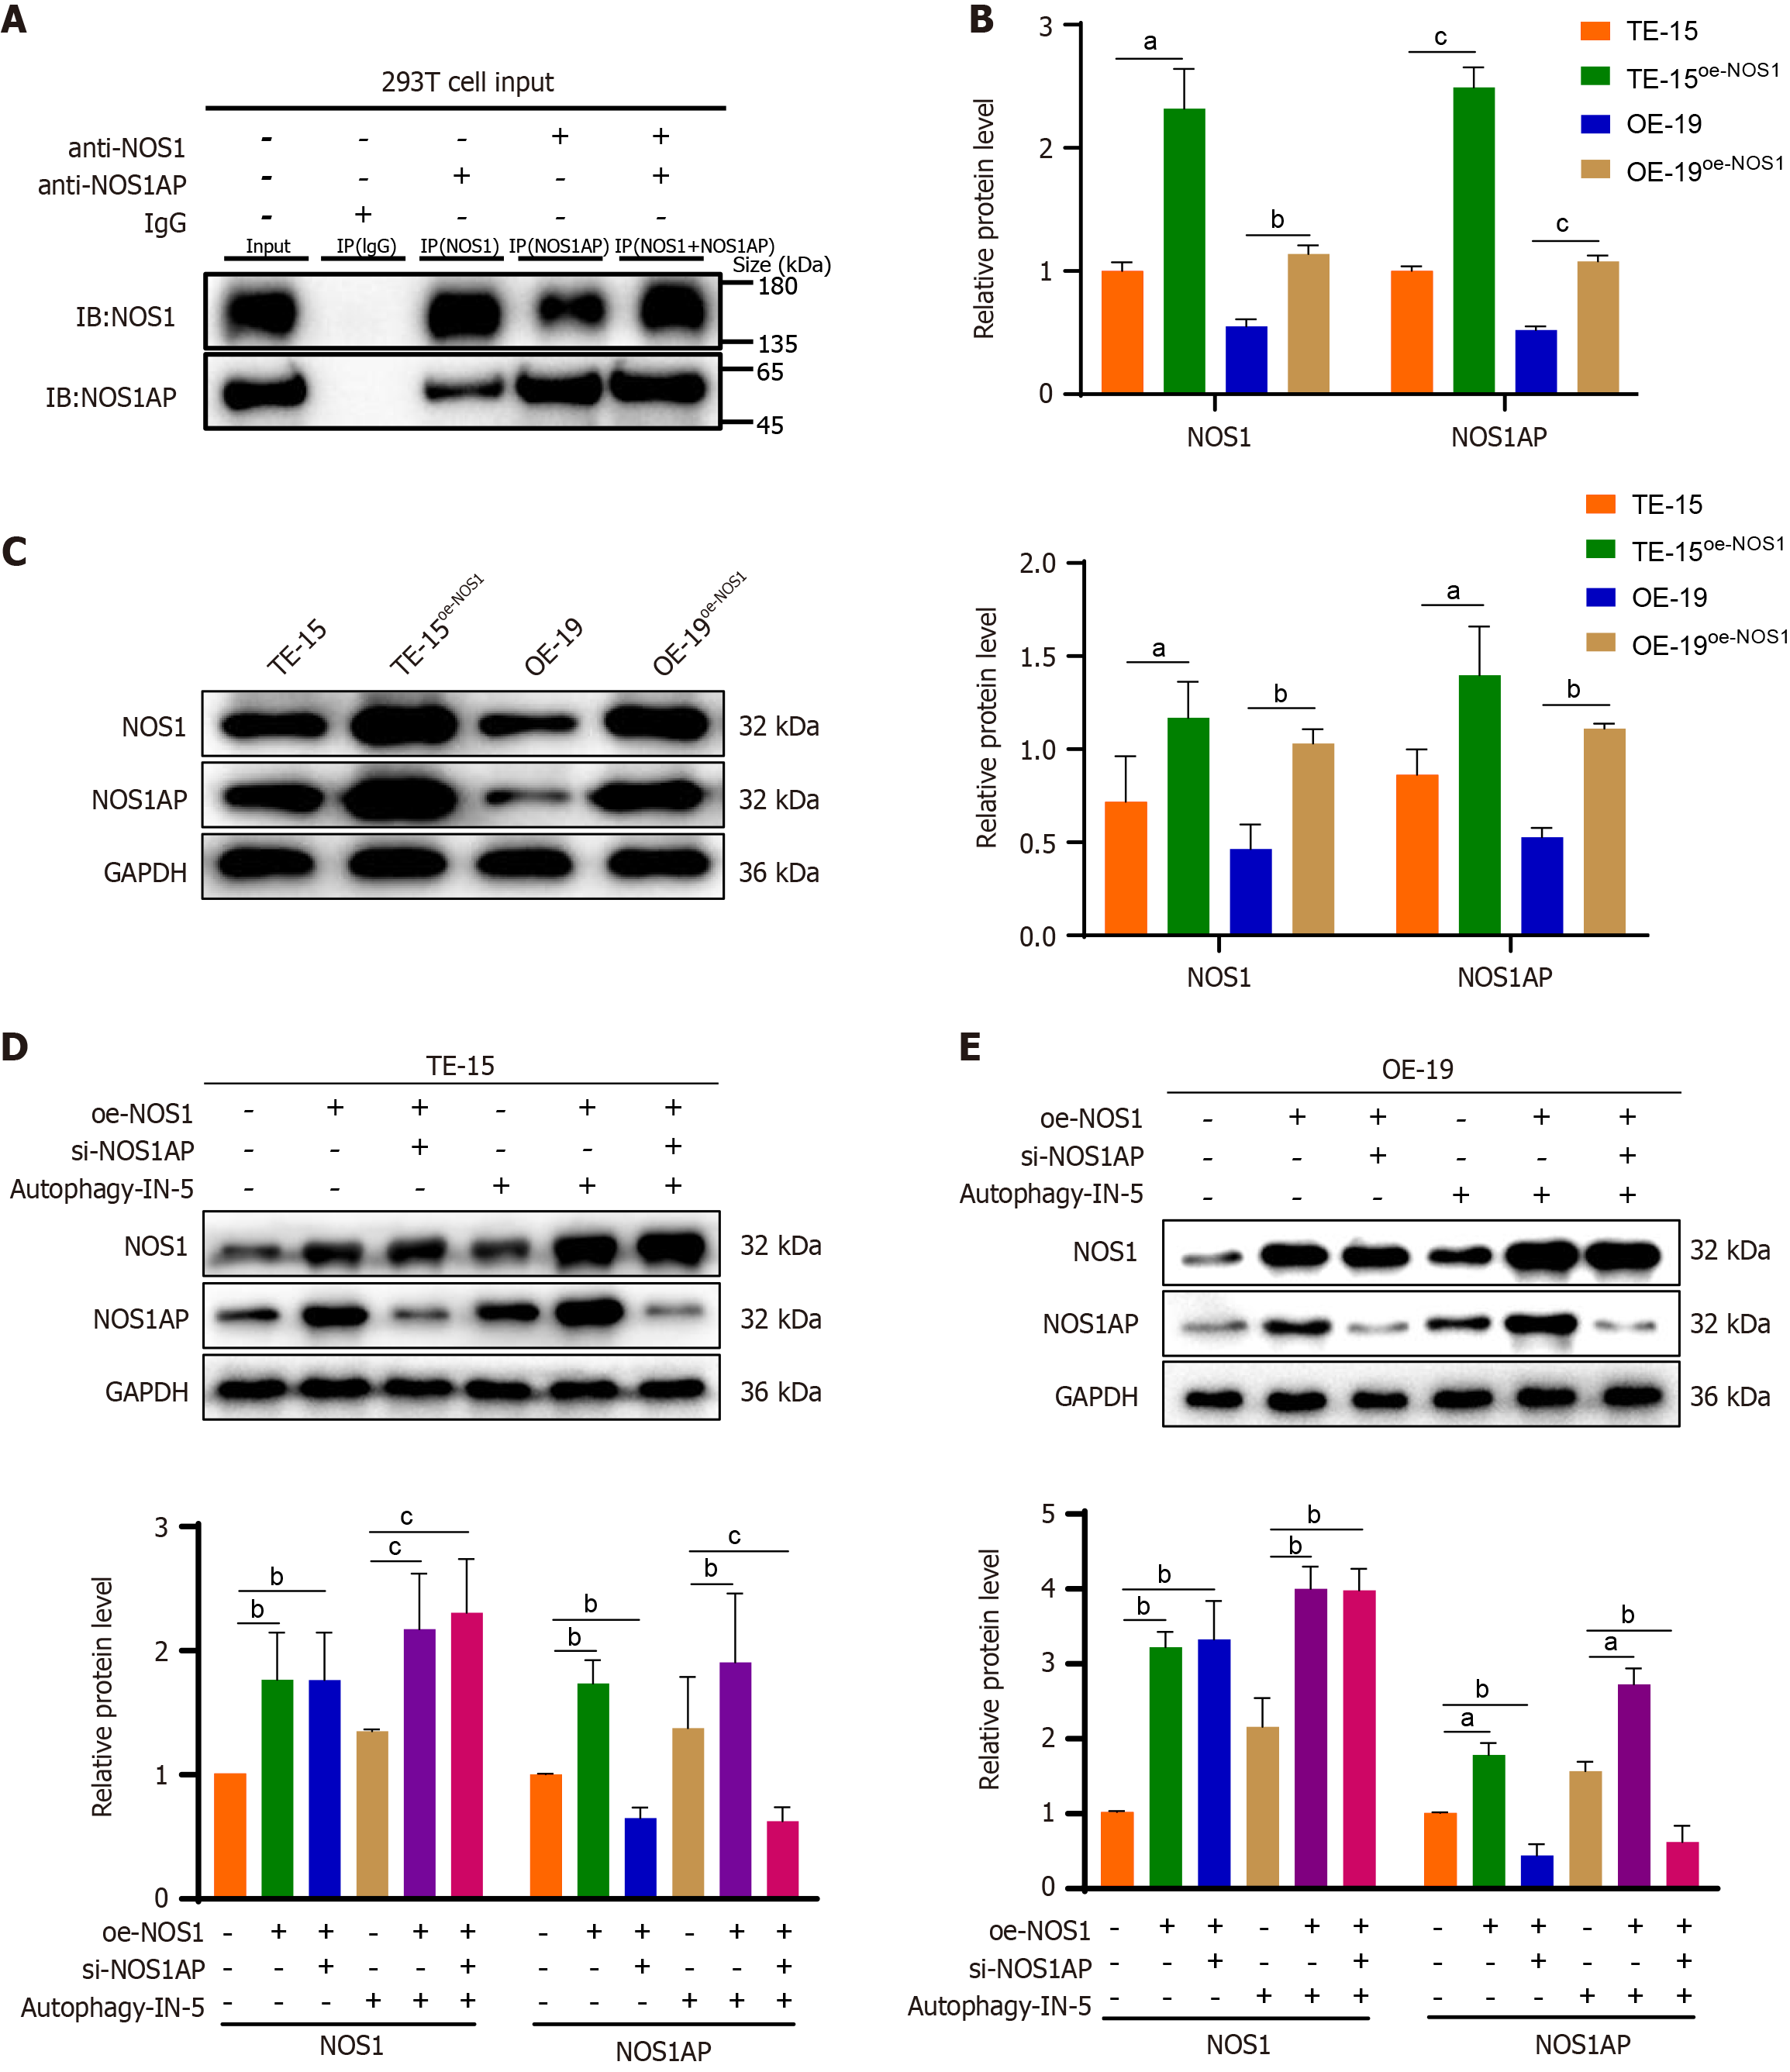
Figure 6 Nitric oxide synthase 1 and nitric oxide synthase 1 adaptor protein interaction.
A: Immunoprecipitation analysis of the interaction between nitric oxide synthase 1 (NOS1) and nitric oxide synthase 1 adaptor protein (NOS1AP); B and C: Effect of NOS1 expression level on NOS1AP expression level; Quantitative real-time polymerase chain reaction (B); Western blotting (C); D and E: Western Blotting to detect the changes of NOS1 and NOS1AP expression in TE-15 and OE-19 cell lines after inhibition of autophagy; TE-15 cell line (D); OE-19 cell line (E). Values are mean ± SD. aP < 0.05. bP < 0.01. cP < 0.001. n = 3 experiments. NOS1: Nitric oxide synthase 1; NOS1AP: Nitric oxide synthase 1 adaptor protein; IB: Immunoblotting; IP: Immunoprecipitation; oe-NOS1: Overexpression of nitric oxide synthase 1; GAPDH: Glyceraldehyde-3-phosphate dehydrogenase; si-NOS1AP: Silencing of nitric oxide synthase 1 adaptor protein.
- Citation: Xiao ZW, Zeng YC, Ji LT, Yuan JT, Li L. Nitric oxide synthase 1 inhibits the progression of esophageal cancer through interacting with nitric oxide synthase 1 adaptor protein. World J Gastrointest Oncol 2025; 17(4): 103843
- URL: https://www.wjgnet.com/1948-5204/full/v17/i4/103843.htm
- DOI: https://dx.doi.org/10.4251/wjgo.v17.i4.103843


