Copyright
©The Author(s) 2025.
World J Gastrointest Oncol. Apr 15, 2025; 17(4): 103455
Published online Apr 15, 2025. doi: 10.4251/wjgo.v17.i4.103455
Published online Apr 15, 2025. doi: 10.4251/wjgo.v17.i4.103455
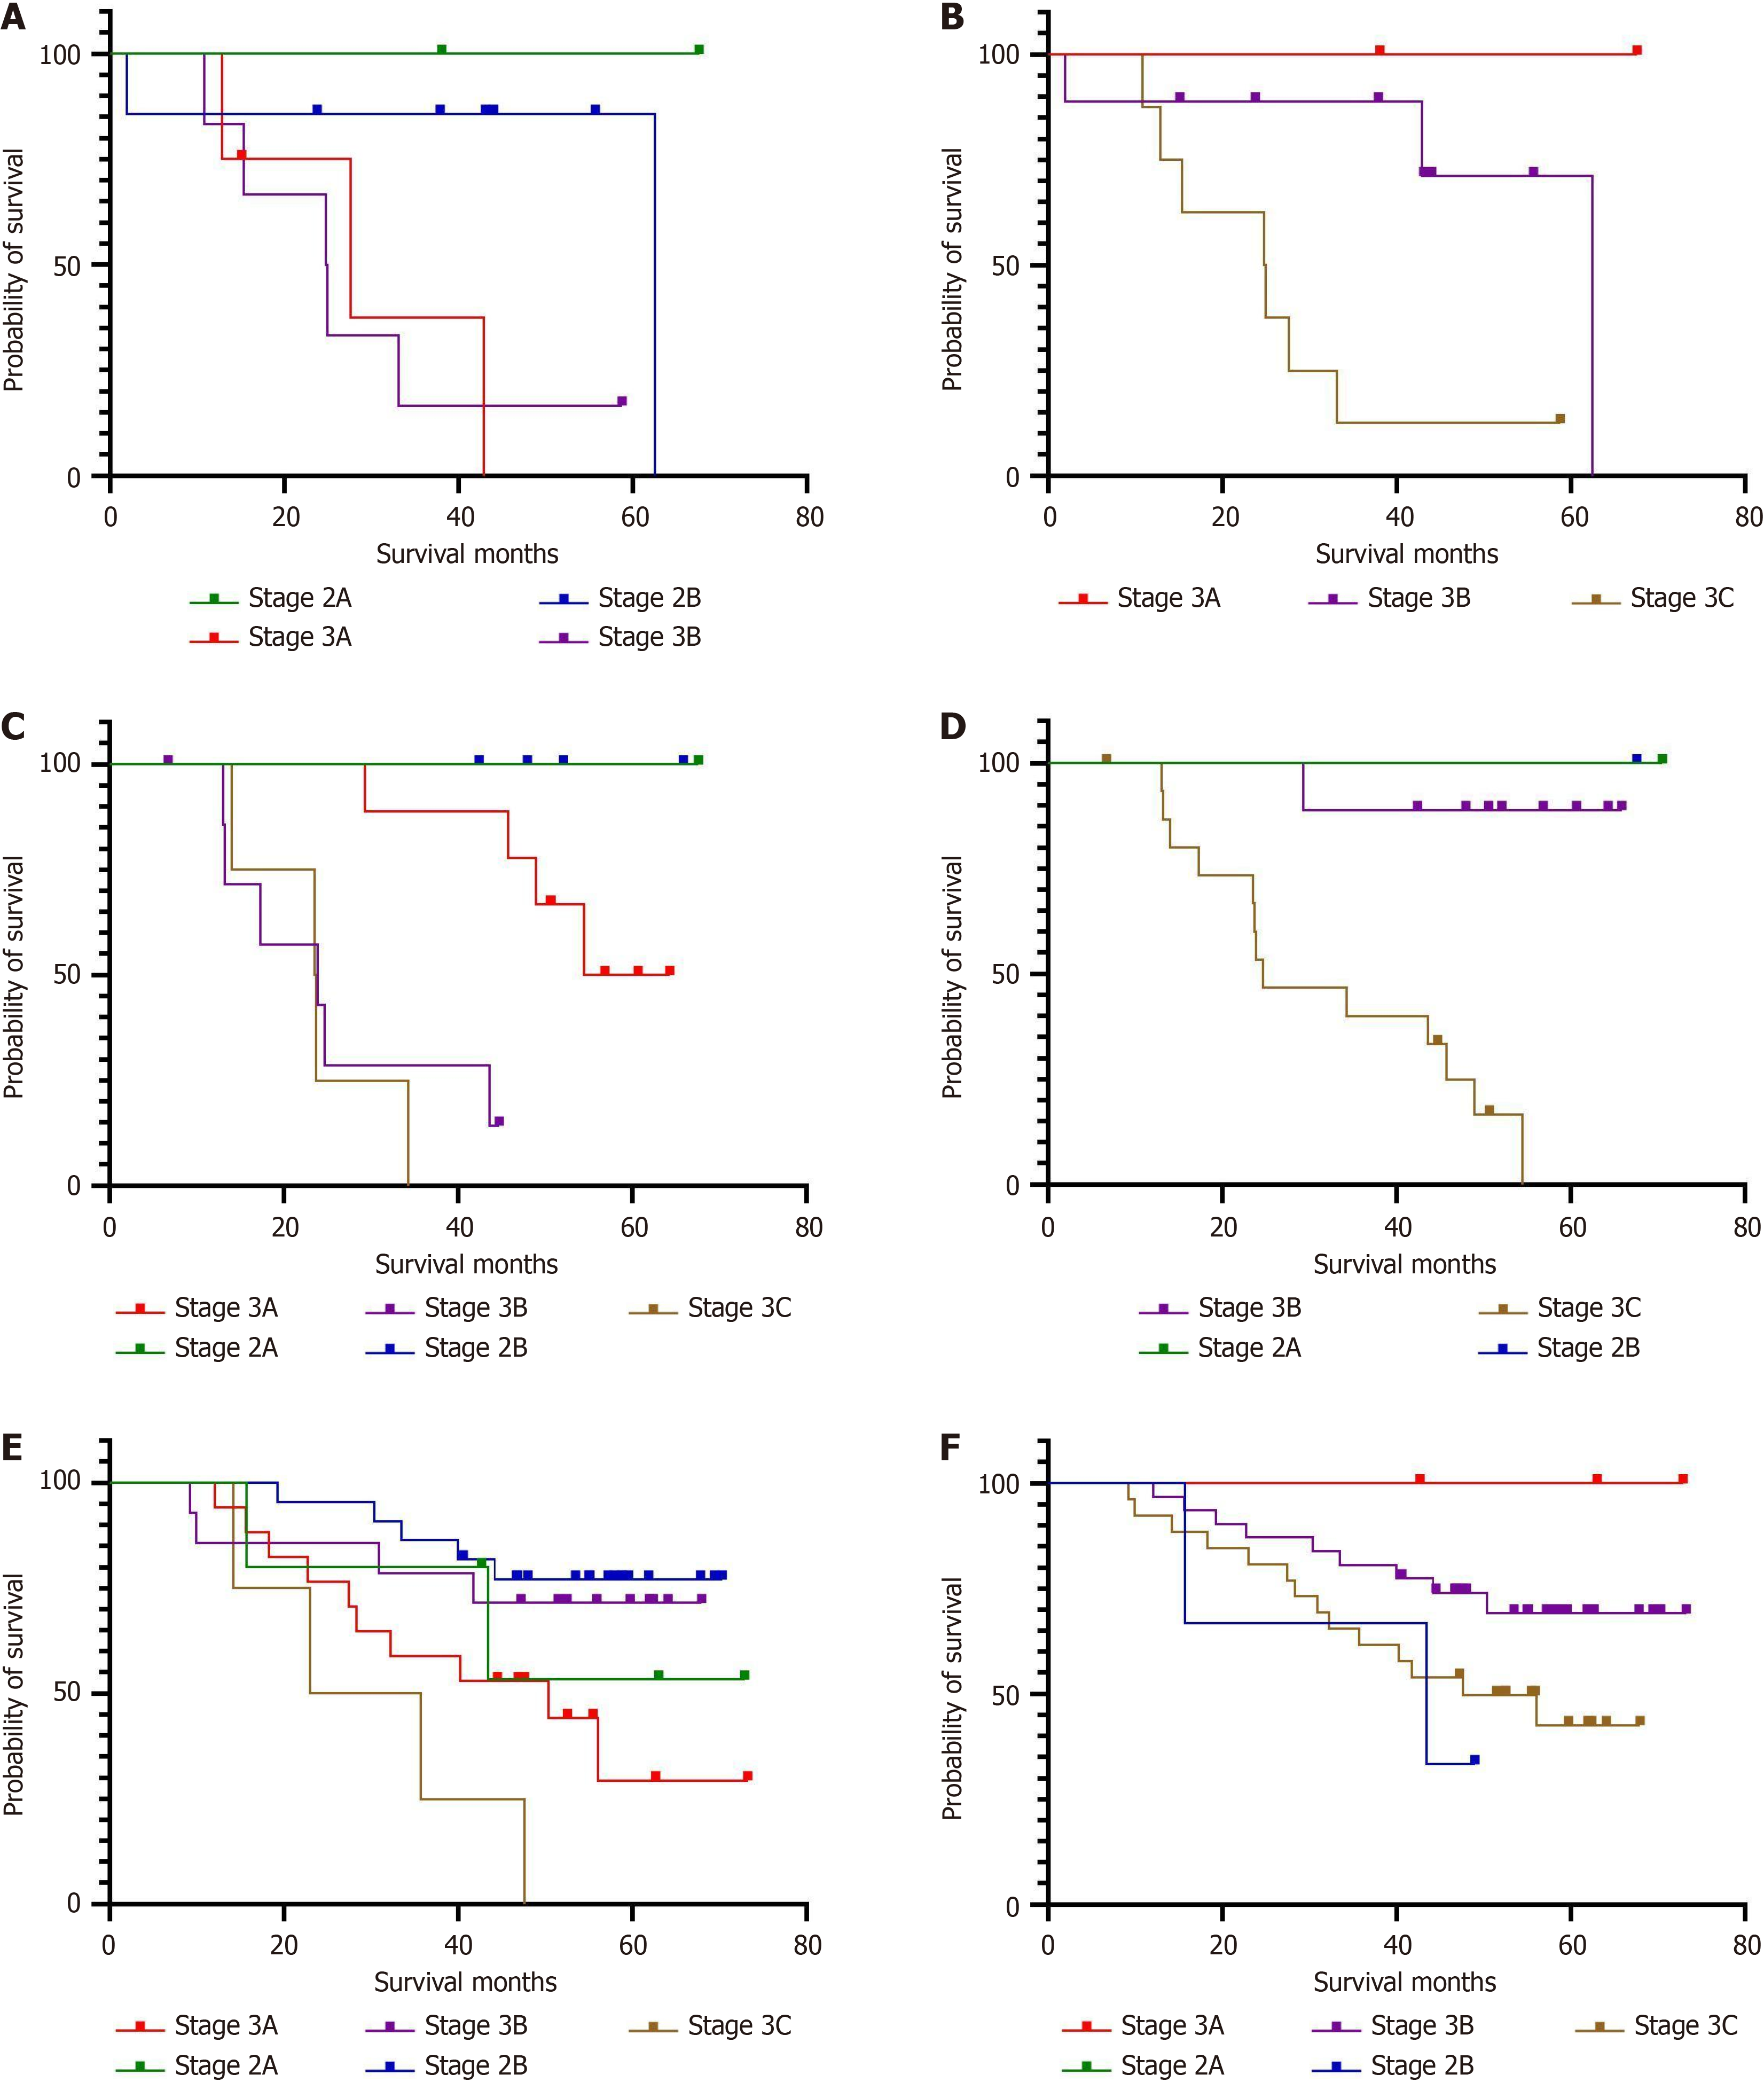
Figure 3 Comparison of survival curves for adenocarcinoma of the esophagogastric junction with different stages in the staging system of gastric cancer and esophageal adenocarcinoma.
A and B: Comparison of survival curves for type E adenocarcinoma of the esophagogastric junction (AEG) with different stages in the staging system of gastric cancer and esophageal adenocarcinoma (P = 0.039 vs P = 0.011); C and D: Comparison of survival curves for type Eg AEG with different stages in gastric cancer and esophageal adenocarcinoma staging system (P = 0.000 vs P = 0.002); E and F: Comparison of survival curves of type Ge AEG with different stages in staging system of gastric cancer and esophageal adenocarcinoma (P = 0.005 vs P = 0.113). AEG: Adenocarcinoma of the esophagogastric junction.
- Citation: Guo S, Liu FF, Yuan L, Ma WQ, Er LM, Zhao Q. Subclassification scheme for adenocarcinomas of the esophagogastric junction and prognostic analysis based on clinicopathological features. World J Gastrointest Oncol 2025; 17(4): 103455
- URL: https://www.wjgnet.com/1948-5204/full/v17/i4/103455.htm
- DOI: https://dx.doi.org/10.4251/wjgo.v17.i4.103455


