Copyright
©The Author(s) 2025.
World J Gastrointest Oncol. Apr 15, 2025; 17(4): 103048
Published online Apr 15, 2025. doi: 10.4251/wjgo.v17.i4.103048
Published online Apr 15, 2025. doi: 10.4251/wjgo.v17.i4.103048
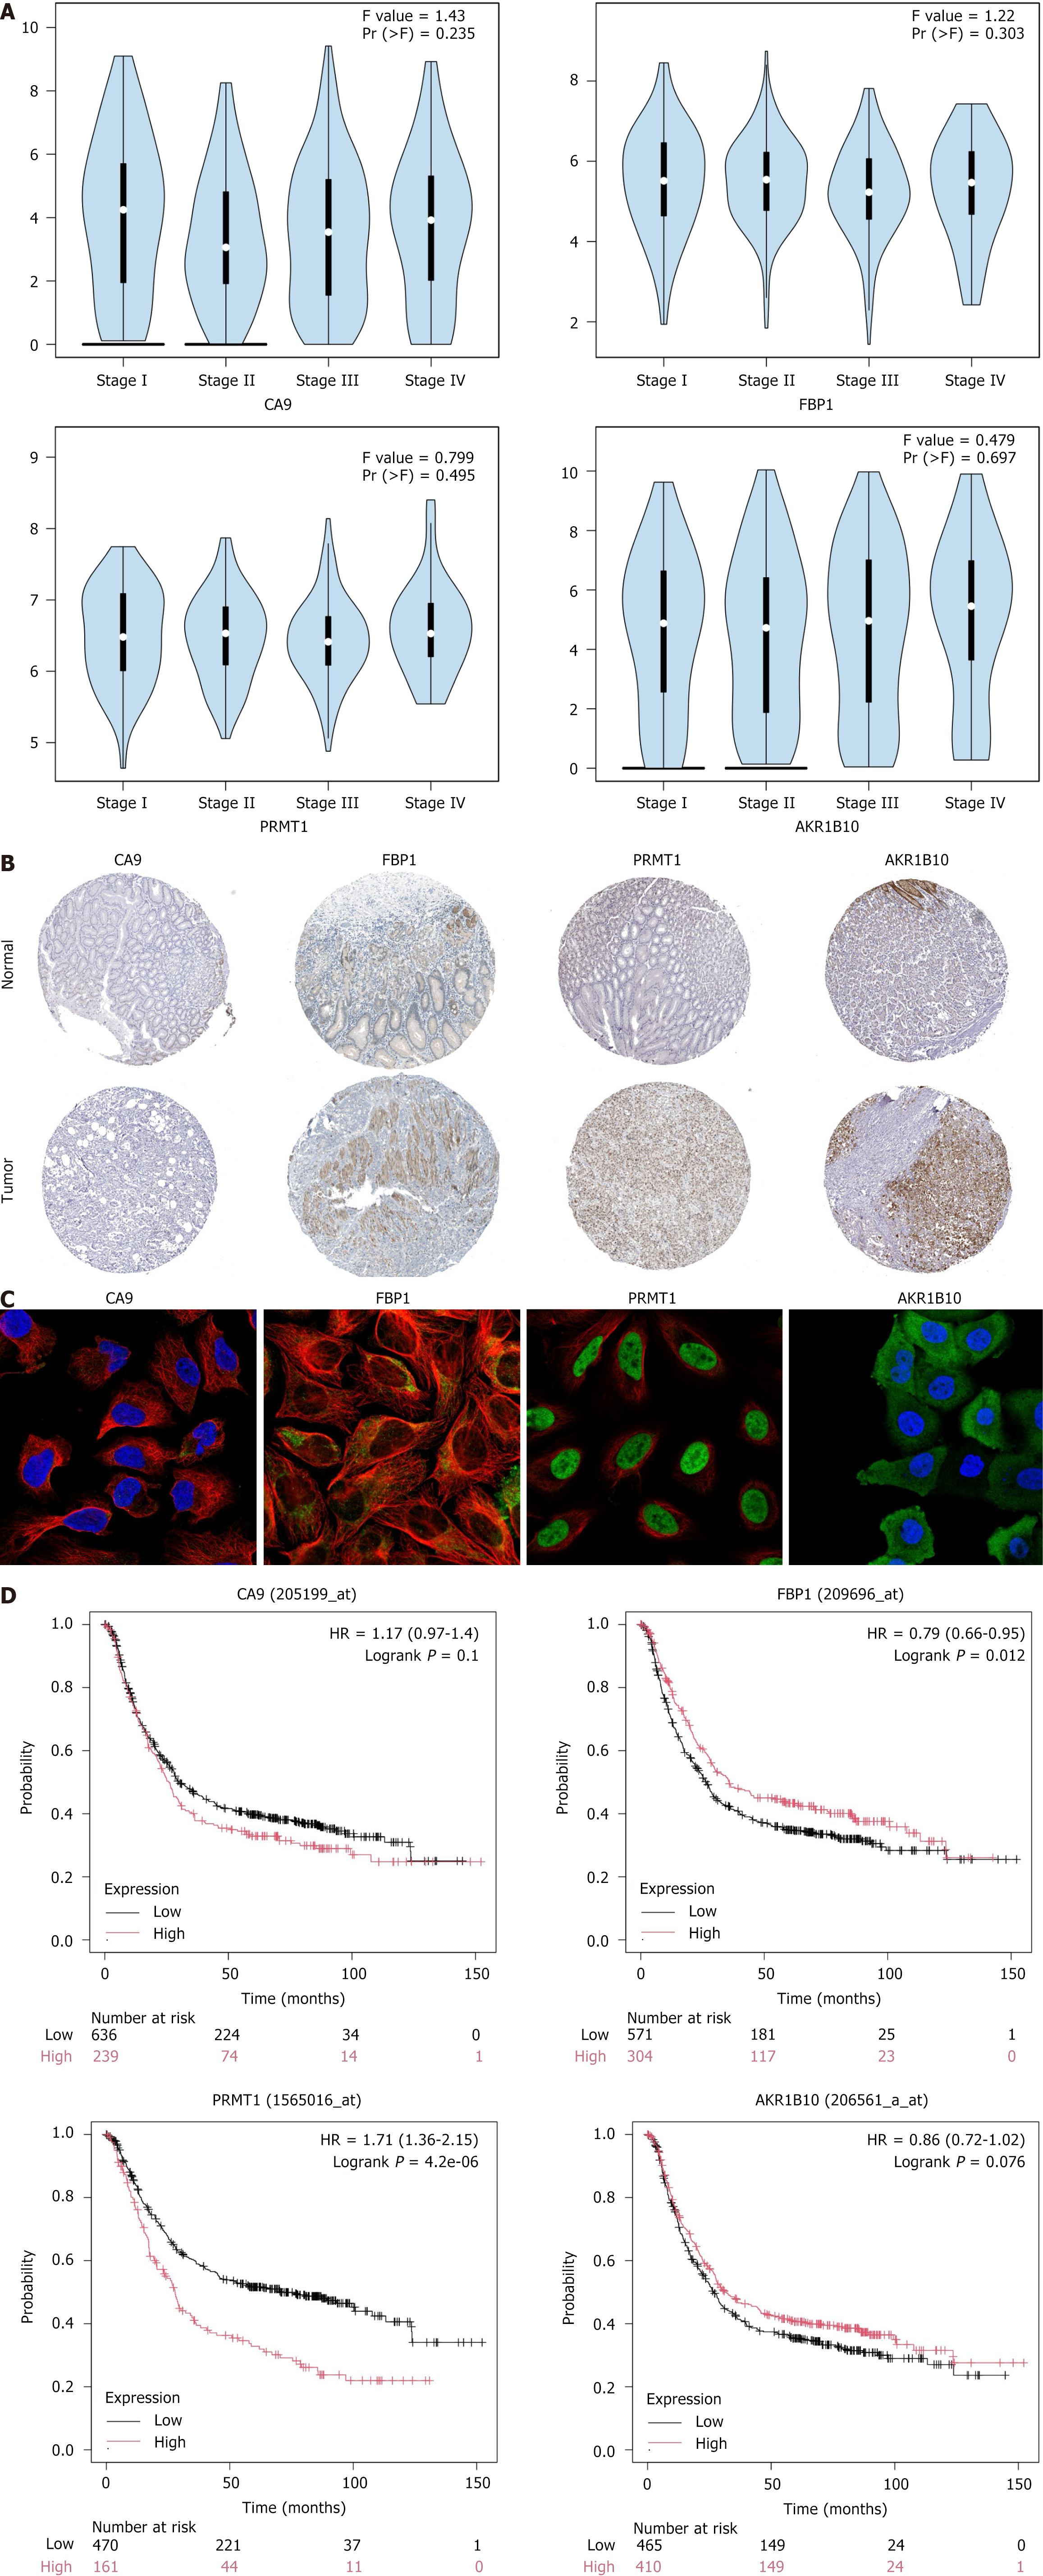
Figure 6 Expression and prognostic analysis of hub genes.
A. Correlation between hub genes and clinical stage of gastric cancer; B: Immunohistochemistry staining for proteins encoded by hub genes in normal gastric tissue and gastric adenocarcinoma tissue. Brown color shows the expression level of proteins encoded by hub genes; C: Fluorescence localization map of proteins encoded by hub genes in tumor tissues. Blue represents the nucleus, red represents microtubule organization, and green represents hub genes; D: Survival curve diagram of hub genes. The horizontal coordinate represents the survival time. CA9: Carbonic anhydrase 9; FBP1: Fructose-bisphosphatase 1; PRMT1: Protein arginine methyltransferase 1; AKR1B10: Aldo-keto reductase family 1 member B10.
- Citation: Meng FD, Jia SM, Ma YB, Du YH, Liu WJ, Yang Y, Yuan L, Nan Y. Identification of key hub genes associated with anti-gastric cancer effects of lotus plumule based on machine learning algorithms. World J Gastrointest Oncol 2025; 17(4): 103048
- URL: https://www.wjgnet.com/1948-5204/full/v17/i4/103048.htm
- DOI: https://dx.doi.org/10.4251/wjgo.v17.i4.103048


