Copyright
©The Author(s) 2025.
World J Gastrointest Oncol. Apr 15, 2025; 17(4): 103048
Published online Apr 15, 2025. doi: 10.4251/wjgo.v17.i4.103048
Published online Apr 15, 2025. doi: 10.4251/wjgo.v17.i4.103048
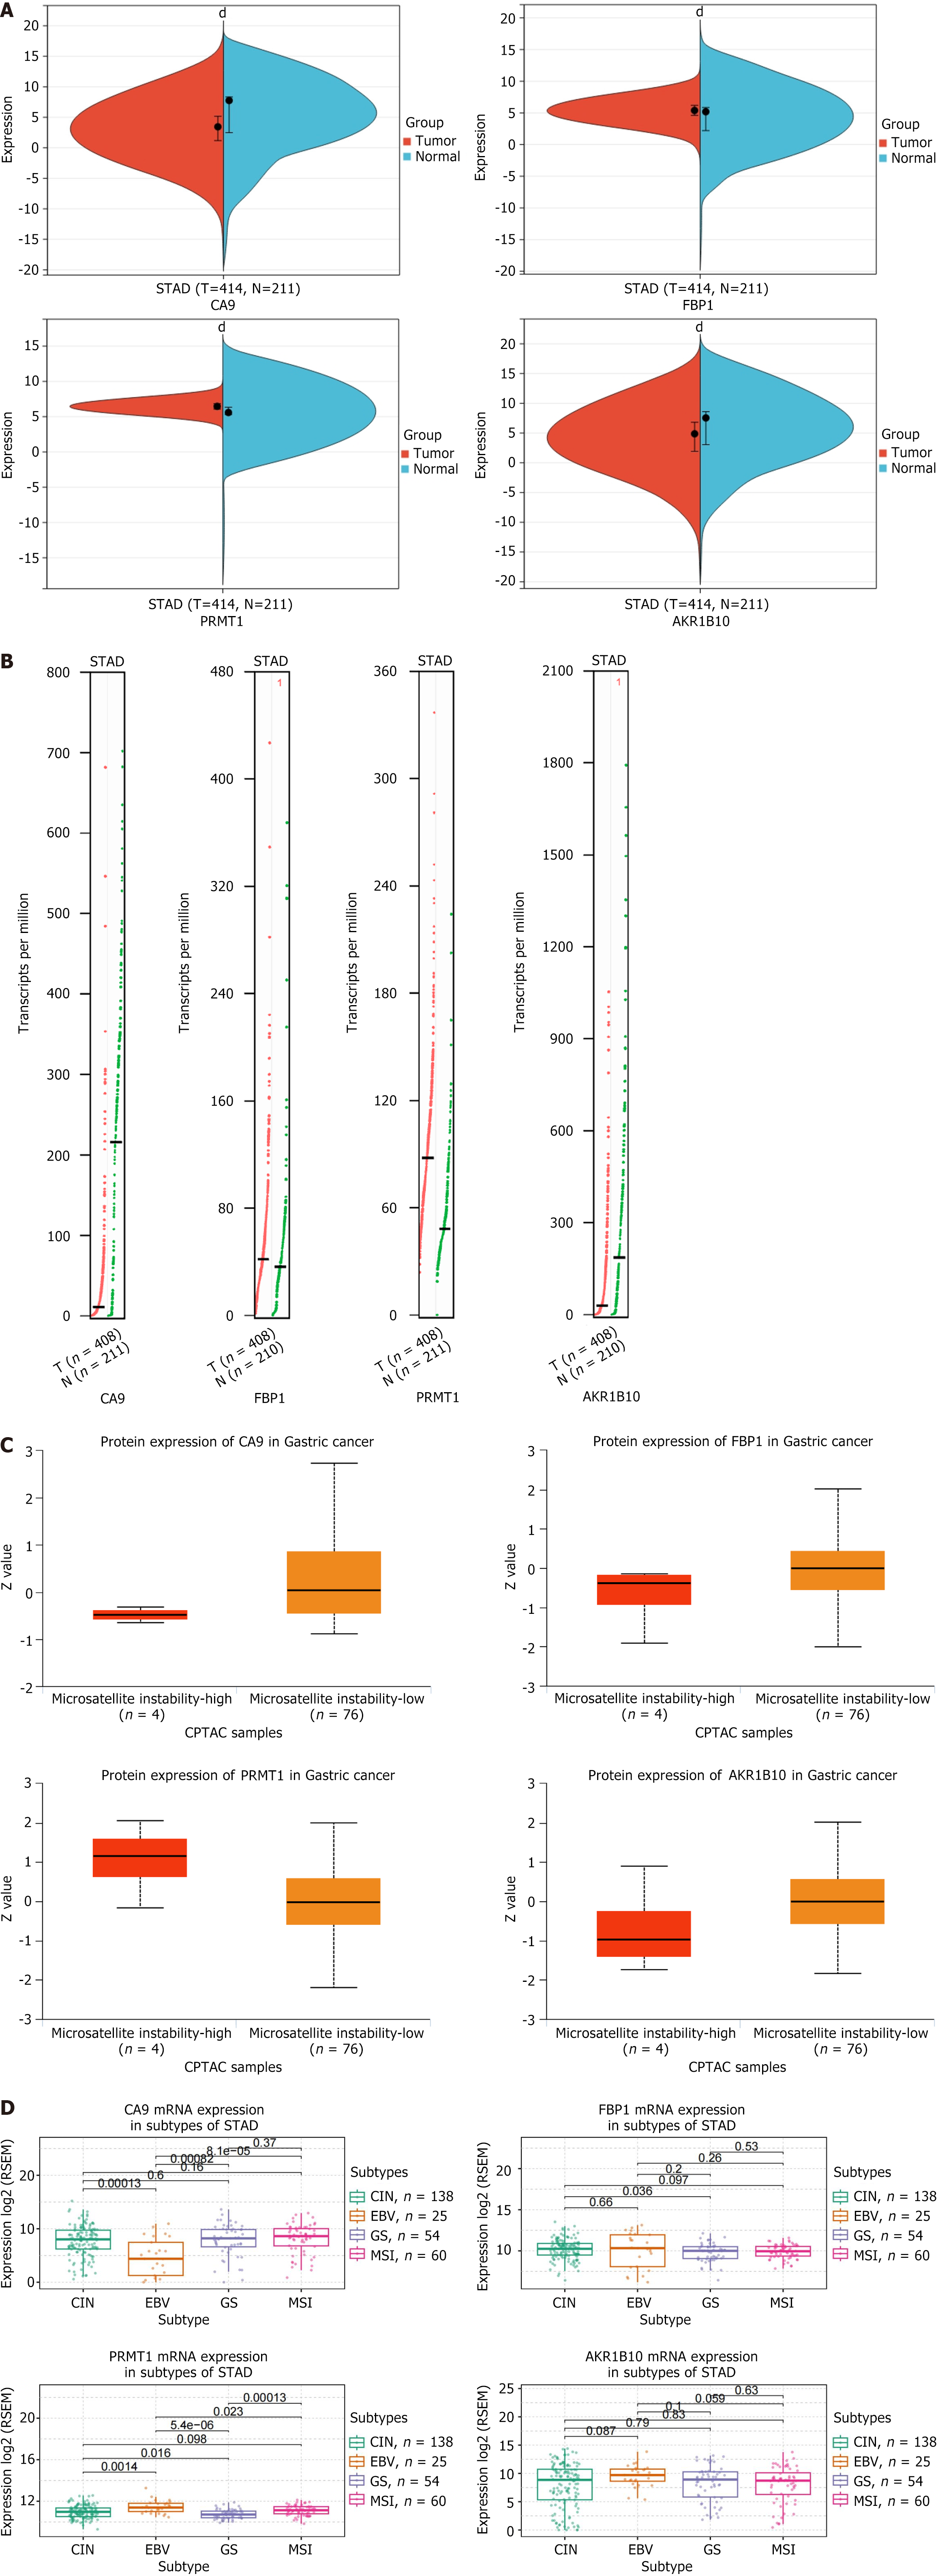
Figure 5 Clinical correlation analysis of hub genes.
A: Expression levels of hub gene mRNA. Red represents the tumor group and blue represents the normal group; B: Expression levels of hub gene copy number. Red represents the tumor group and green represents the normal group; C: Expression level of hub gene protein. Red represents the microsatellite instability group and orange represents the microsatellite stability group; D: Expression levels of hub genes in gastric cancer subtypes. dP < 0.0001. CA9: Carbonic anhydrase 9; FBP1: Fructose-bisphosphatase 1; PRMT1: Protein arginine methyltransferase 1; AKR1B10: Aldo-keto reductase family 1 member B10; CIN: Chromosomal instability; EBV: EB virus; GS: Genome stability; MSI: Microsatellite instability.
- Citation: Meng FD, Jia SM, Ma YB, Du YH, Liu WJ, Yang Y, Yuan L, Nan Y. Identification of key hub genes associated with anti-gastric cancer effects of lotus plumule based on machine learning algorithms. World J Gastrointest Oncol 2025; 17(4): 103048
- URL: https://www.wjgnet.com/1948-5204/full/v17/i4/103048.htm
- DOI: https://dx.doi.org/10.4251/wjgo.v17.i4.103048


