Copyright
©The Author(s) 2025.
World J Gastrointest Oncol. Apr 15, 2025; 17(4): 103048
Published online Apr 15, 2025. doi: 10.4251/wjgo.v17.i4.103048
Published online Apr 15, 2025. doi: 10.4251/wjgo.v17.i4.103048
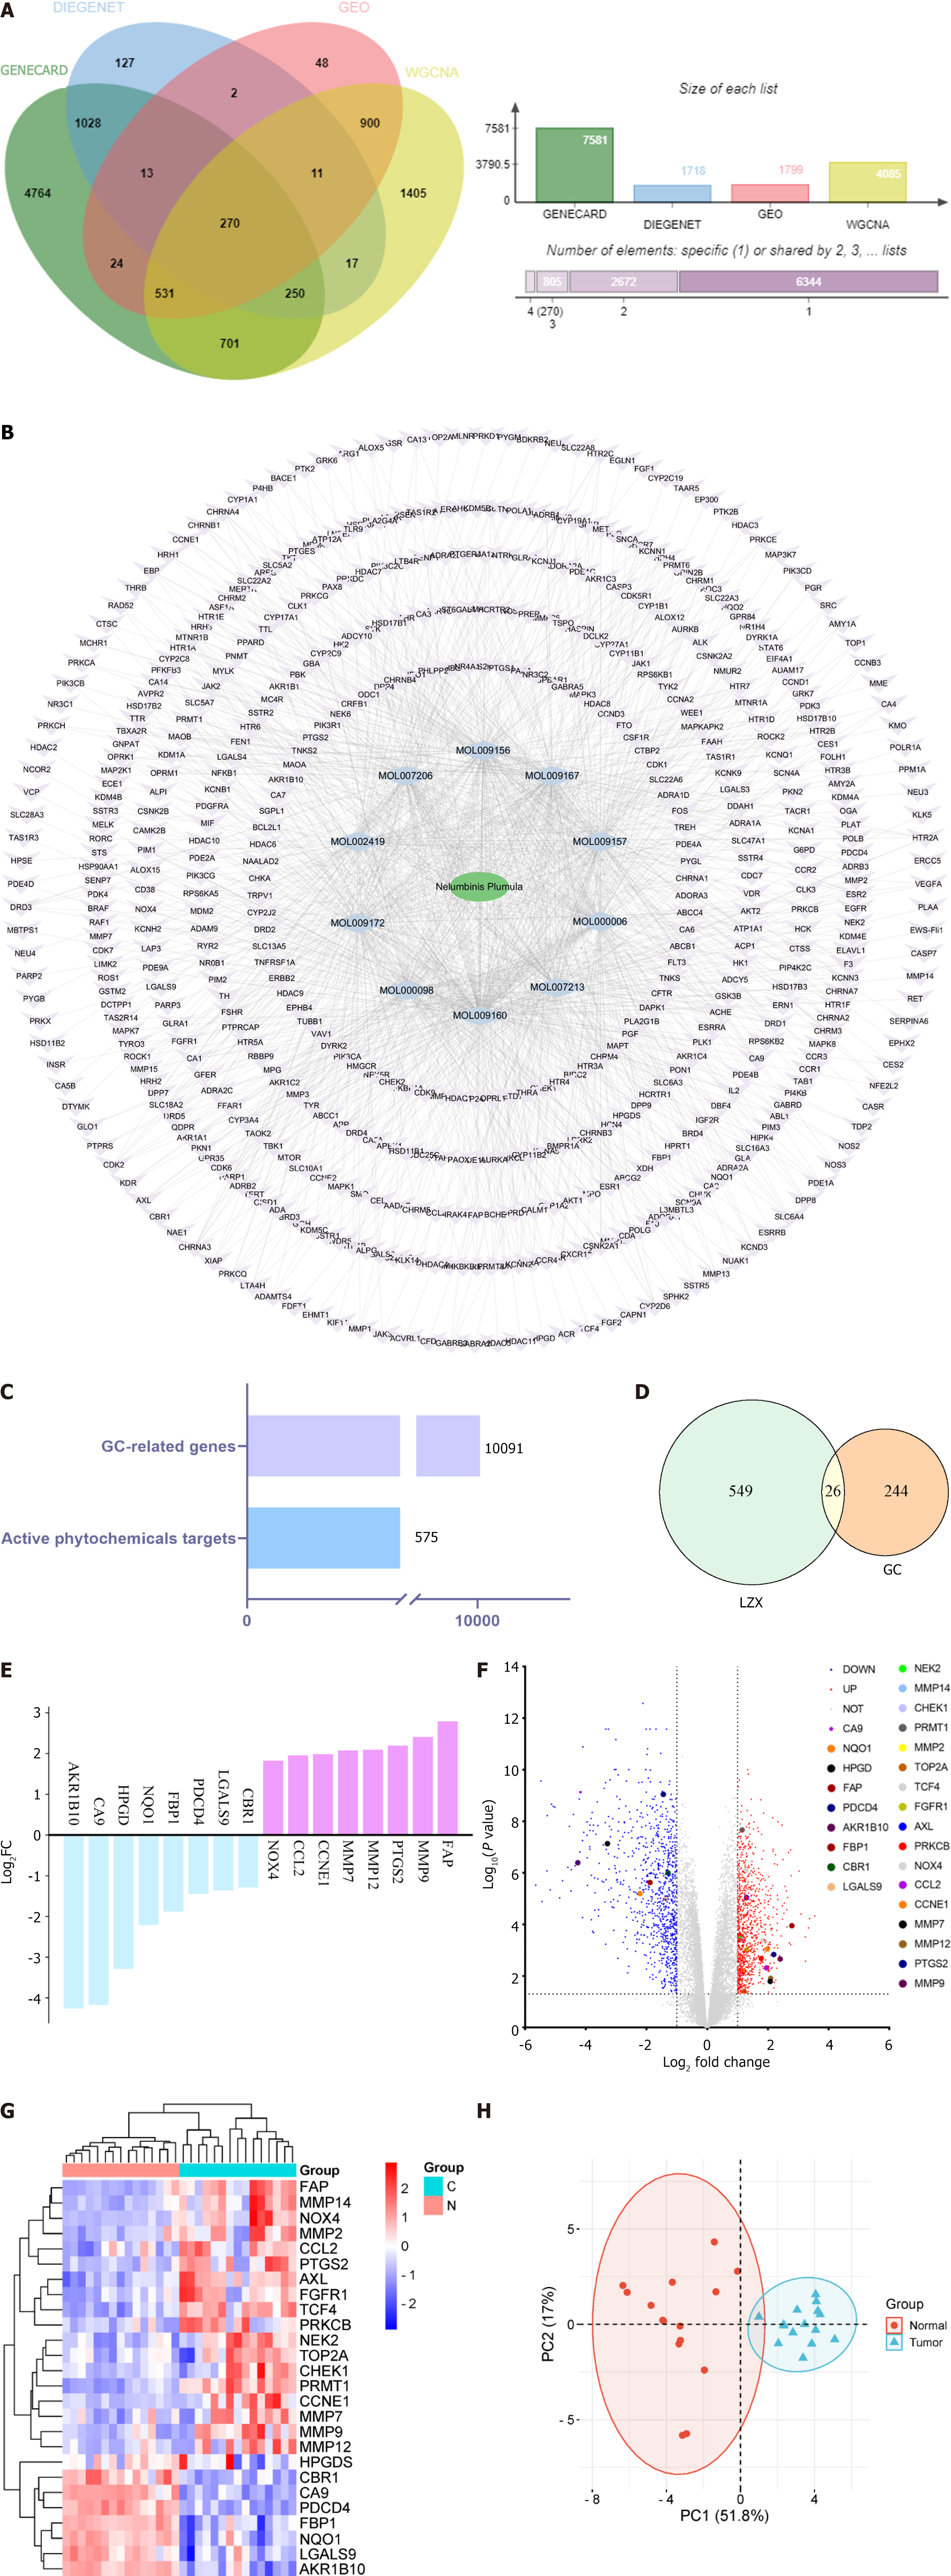
Figure 2 Targets of LZX active ingredients and differentially expressed genes in gastric cancer.
A: 279 intersection genes of GeneCards, GENENET, weighted gene co-expression network analysis and differential expressed genes (DEGs); B: 575 genes of LZX; C: All genes of gastric cancer and the number of targets of LZX active ingredients; D: 26 intersection genes of gastric cancer and LZX; E: Log2 fold change values of the top 10 up- and down-regulated genes in the intersection targets, where blue and purple represent up- and down-regulated genes, respectively; F: Volcano plot of DEGs in GSE118916; G: Heatmap of DEGs in GSE118916: Comparing the normal group (N) with the tumor group (C); H: Principal co-ordinates analysis plot of the samples of the intersecting targets. Red dots represent normal group samples and green dots represent tumor group samples. LZX: Lotus plumule; GEO: Gene Expression Omnibus; WGCNA: Weighted gene co-expression network analysis; GC: Gastric cancer; PC: Principal component.
- Citation: Meng FD, Jia SM, Ma YB, Du YH, Liu WJ, Yang Y, Yuan L, Nan Y. Identification of key hub genes associated with anti-gastric cancer effects of lotus plumule based on machine learning algorithms. World J Gastrointest Oncol 2025; 17(4): 103048
- URL: https://www.wjgnet.com/1948-5204/full/v17/i4/103048.htm
- DOI: https://dx.doi.org/10.4251/wjgo.v17.i4.103048


