Copyright
©The Author(s) 2025.
World J Gastrointest Oncol. Apr 15, 2025; 17(4): 103048
Published online Apr 15, 2025. doi: 10.4251/wjgo.v17.i4.103048
Published online Apr 15, 2025. doi: 10.4251/wjgo.v17.i4.103048
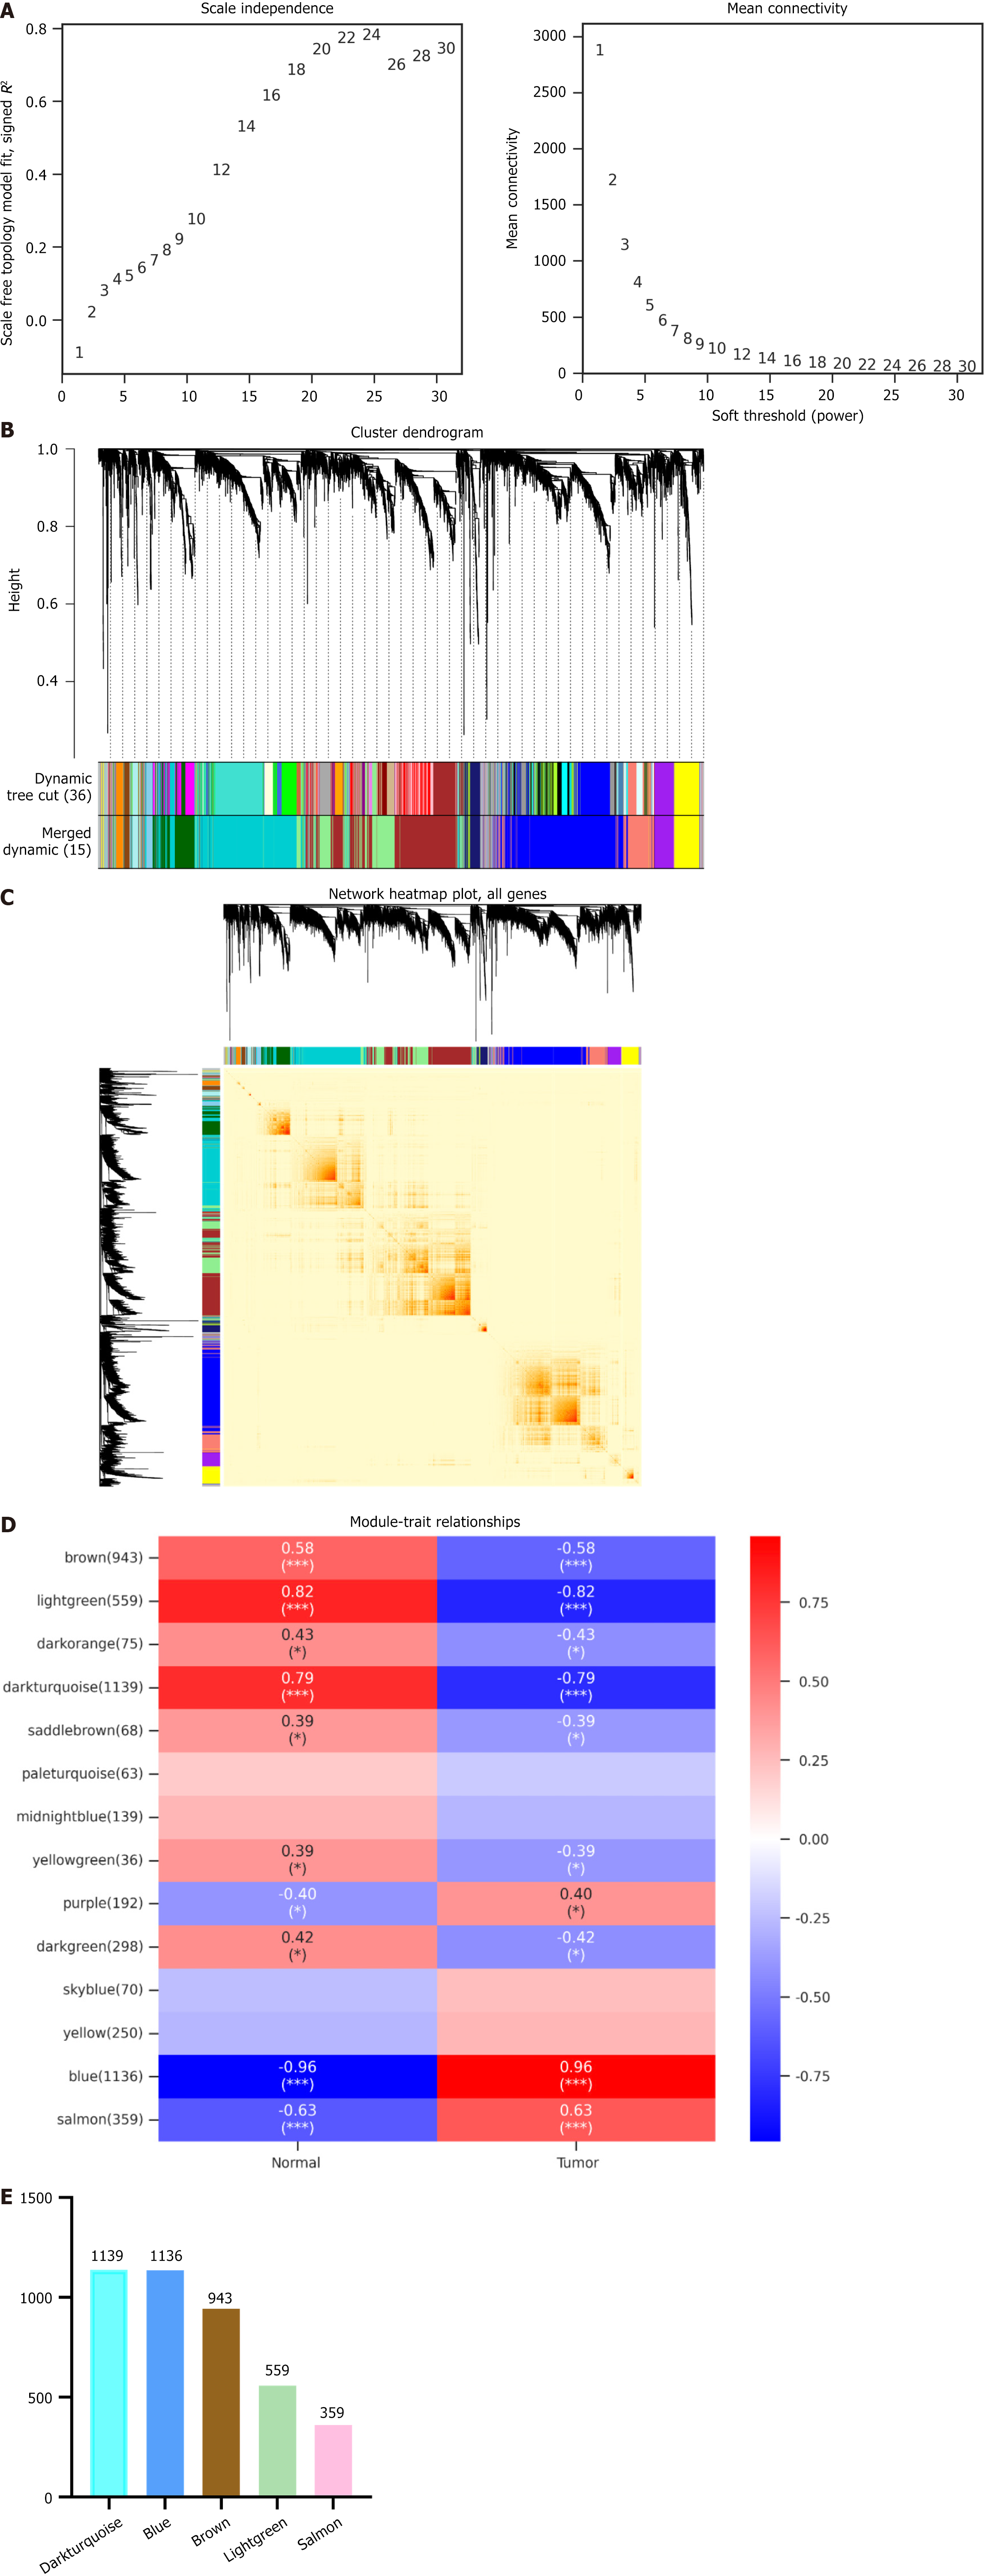
Figure 1 Construction of weighted gene co-expression network analysis.
A: Scale-free fitting index of the network topology obtained by the soft-threshold power analysis method; B: Cluster dendrogram of co-expression network modules from weighted gene co-expression network analysis depending on a dissimilarity measure; C: Genes from the network, using a heat map to describe the topological overlap matrix between genes in the analysis. On a linear scale, the depth of red is positively correlated with the correlation strength between the pair of modules; D: Module-trait relationships between the normal group and the tumor group; E: Number of genes in the first five modules.
- Citation: Meng FD, Jia SM, Ma YB, Du YH, Liu WJ, Yang Y, Yuan L, Nan Y. Identification of key hub genes associated with anti-gastric cancer effects of lotus plumule based on machine learning algorithms. World J Gastrointest Oncol 2025; 17(4): 103048
- URL: https://www.wjgnet.com/1948-5204/full/v17/i4/103048.htm
- DOI: https://dx.doi.org/10.4251/wjgo.v17.i4.103048


