Copyright
©The Author(s) 2025.
World J Gastrointest Oncol. Apr 15, 2025; 17(4): 102438
Published online Apr 15, 2025. doi: 10.4251/wjgo.v17.i4.102438
Published online Apr 15, 2025. doi: 10.4251/wjgo.v17.i4.102438
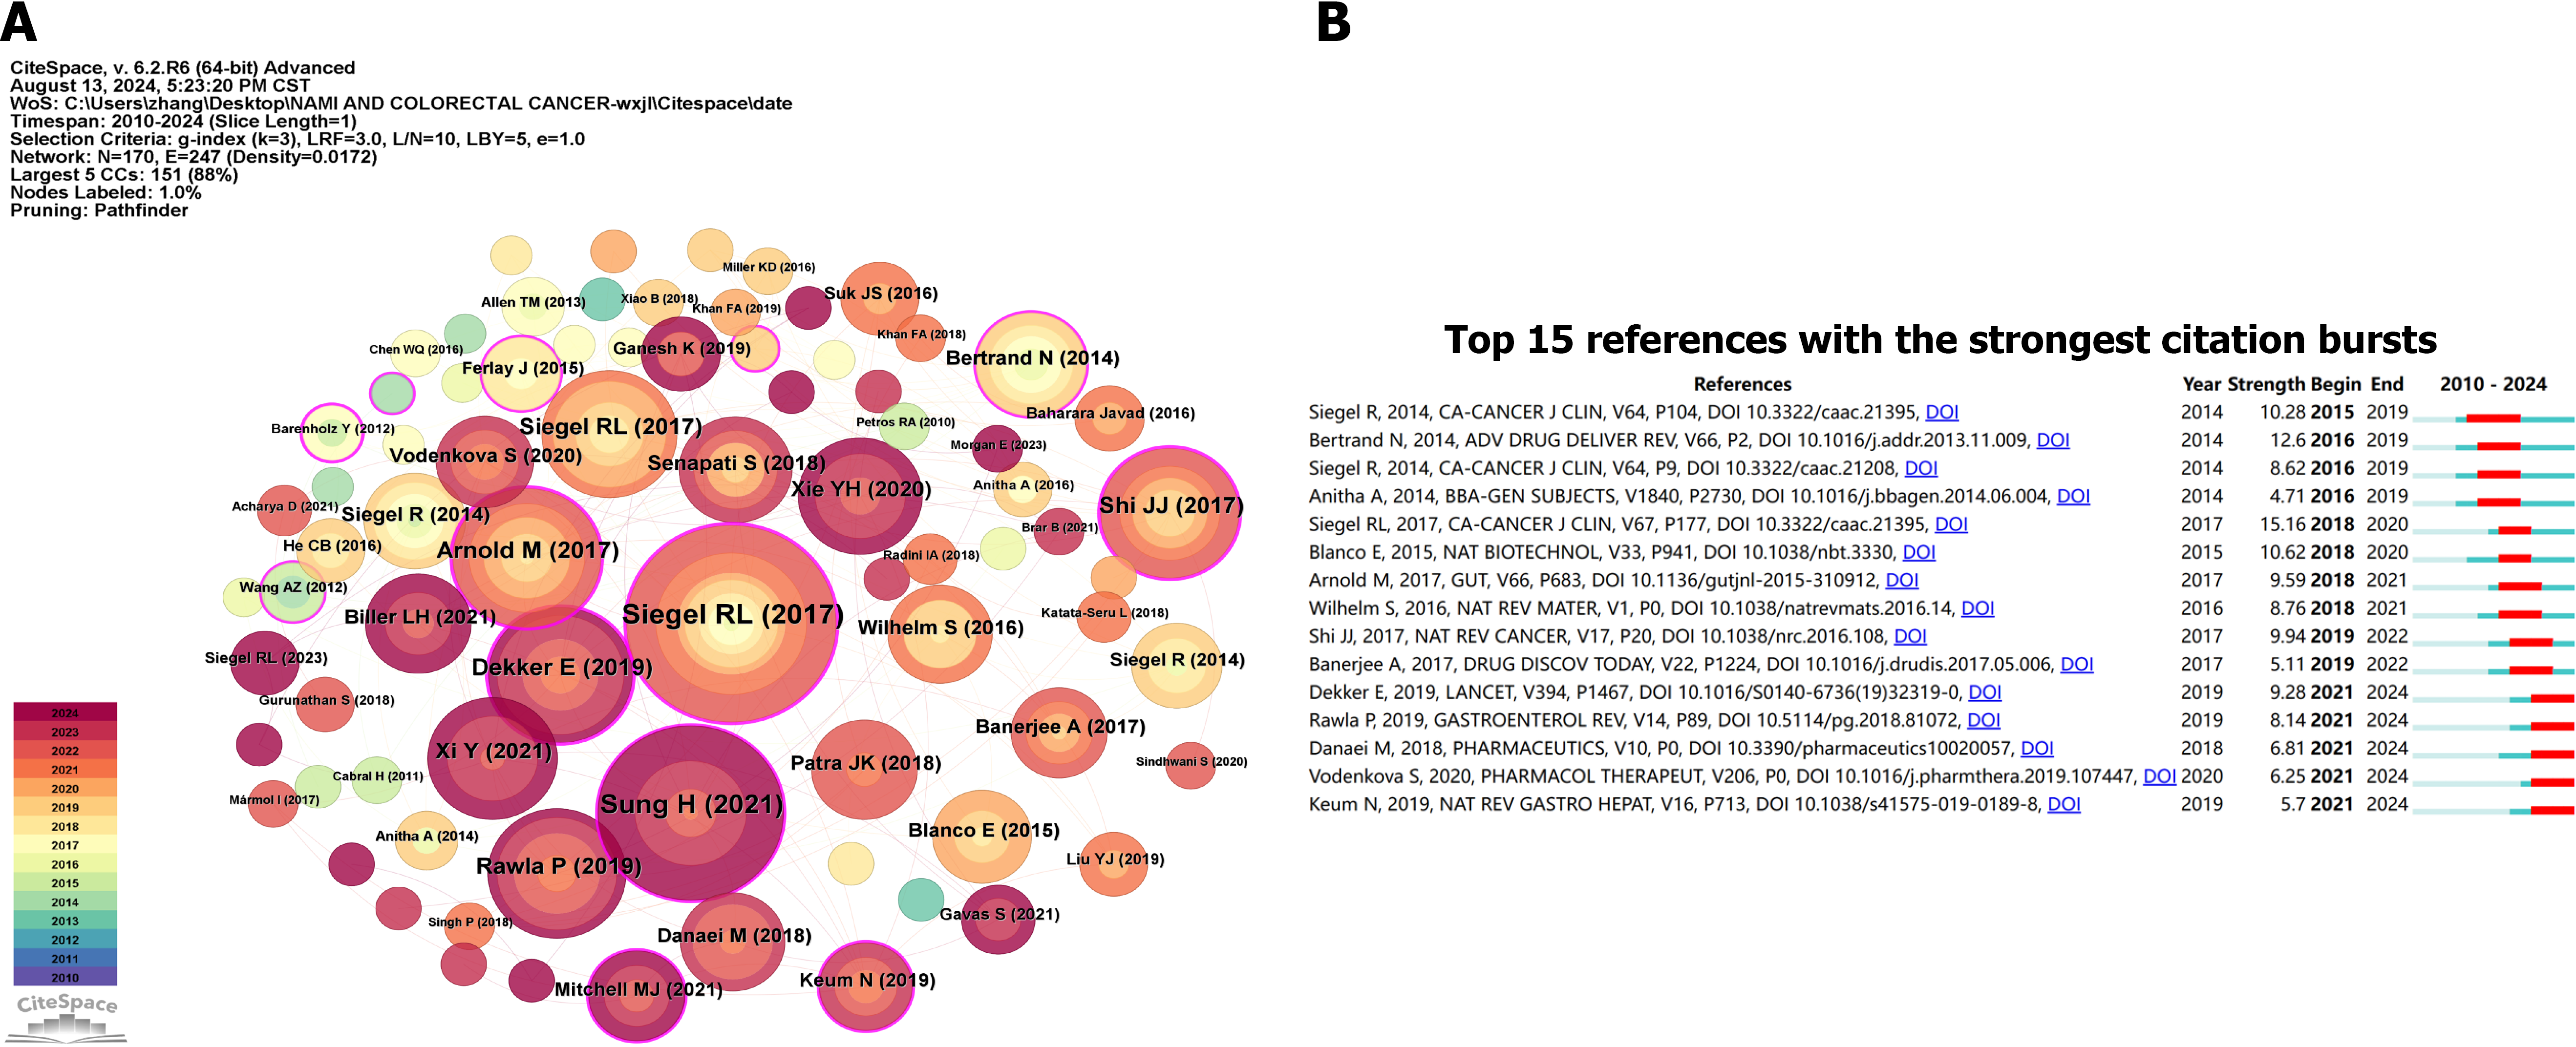
Figure 9 Analysis of cited references.
A: Visualization of cited references. Nodes represent co-cited references. The red circles represent the intermediary centrality of the references; B: The top 15 most cited references with the highest citation burst.
- Citation: Zhang YR, Zhu HR, Li HR, Cheng YL, Yang SH, Sun SL, Wang Z. Trends in nanomedicine for colorectal cancer treatment: Bibliometric and visualization analysis (2010-2024). World J Gastrointest Oncol 2025; 17(4): 102438
- URL: https://www.wjgnet.com/1948-5204/full/v17/i4/102438.htm
- DOI: https://dx.doi.org/10.4251/wjgo.v17.i4.102438


