Copyright
©The Author(s) 2025.
World J Gastrointest Oncol. Apr 15, 2025; 17(4): 102085
Published online Apr 15, 2025. doi: 10.4251/wjgo.v17.i4.102085
Published online Apr 15, 2025. doi: 10.4251/wjgo.v17.i4.102085
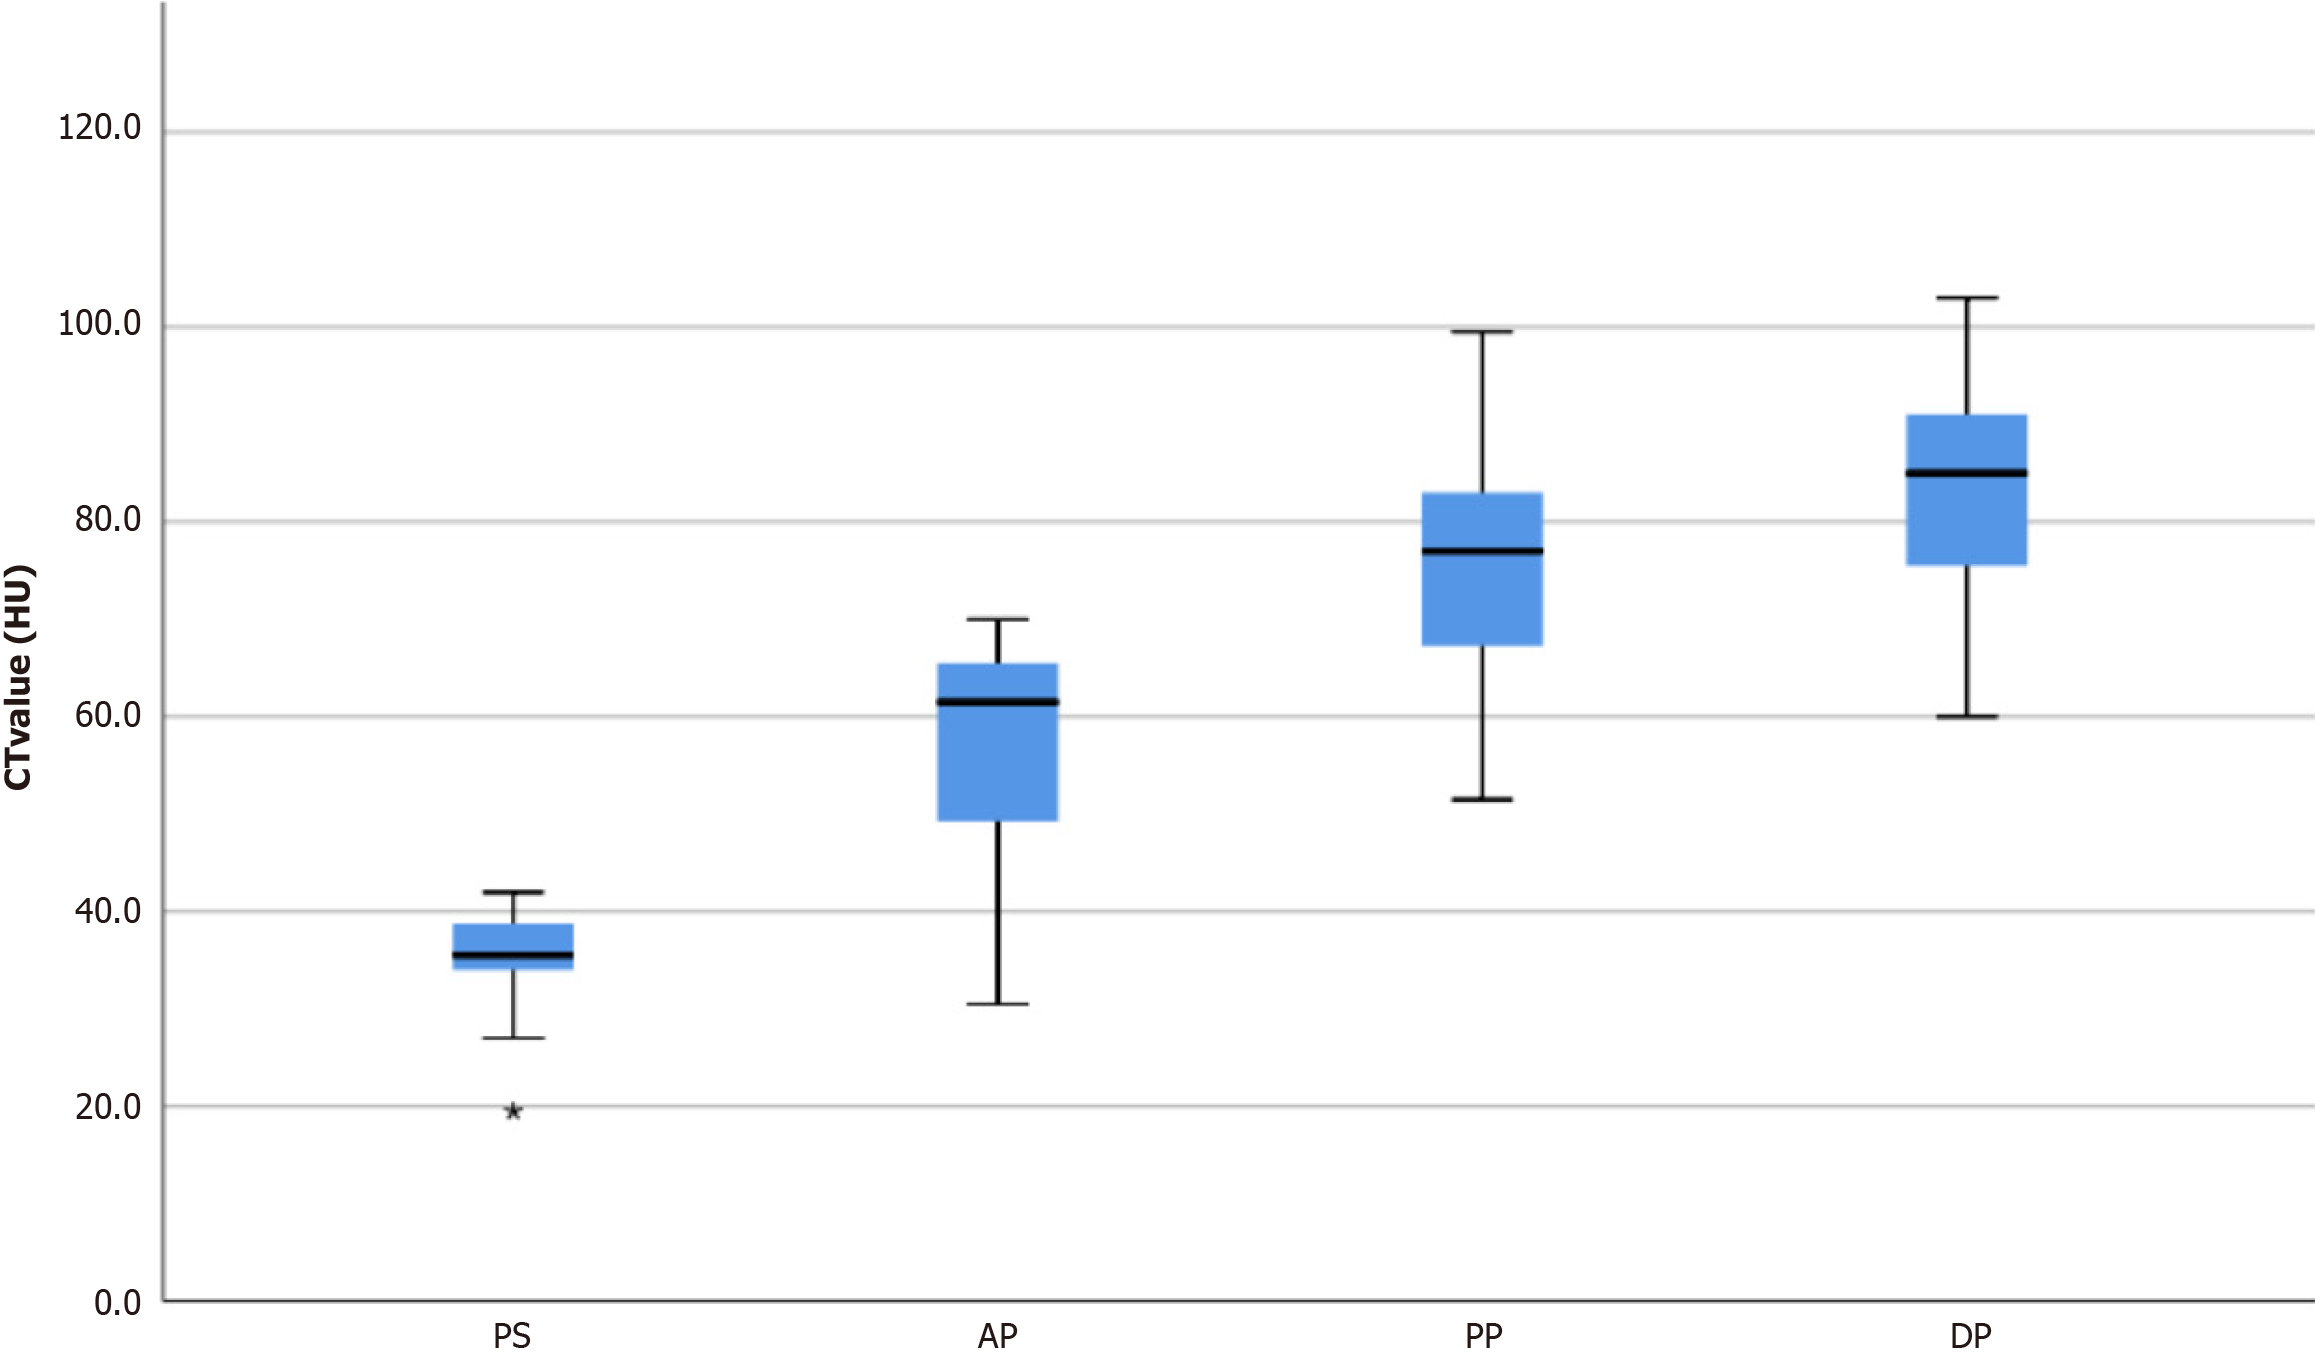
Figure 3 Computed tomography values of all 23 cases in each phase of the contrast-enhanced scan.
CT: Computed tomography; HU: Hounsfield units; PS: Plain phase; AP: Arterial phase; PP: Portal phase; DP: Delayed phase.
- Citation: Mo YK, Chen XP, Hong LL, Hu YR, Lin DY, Xie LC, Dai ZZ. Gastric schwannoma: Computed tomography and perigastric lymph node characteristics. World J Gastrointest Oncol 2025; 17(4): 102085
- URL: https://www.wjgnet.com/1948-5204/full/v17/i4/102085.htm
- DOI: https://dx.doi.org/10.4251/wjgo.v17.i4.102085


