Copyright
©The Author(s) 2025.
World J Gastrointest Oncol. Apr 15, 2025; 17(4): 101925
Published online Apr 15, 2025. doi: 10.4251/wjgo.v17.i4.101925
Published online Apr 15, 2025. doi: 10.4251/wjgo.v17.i4.101925
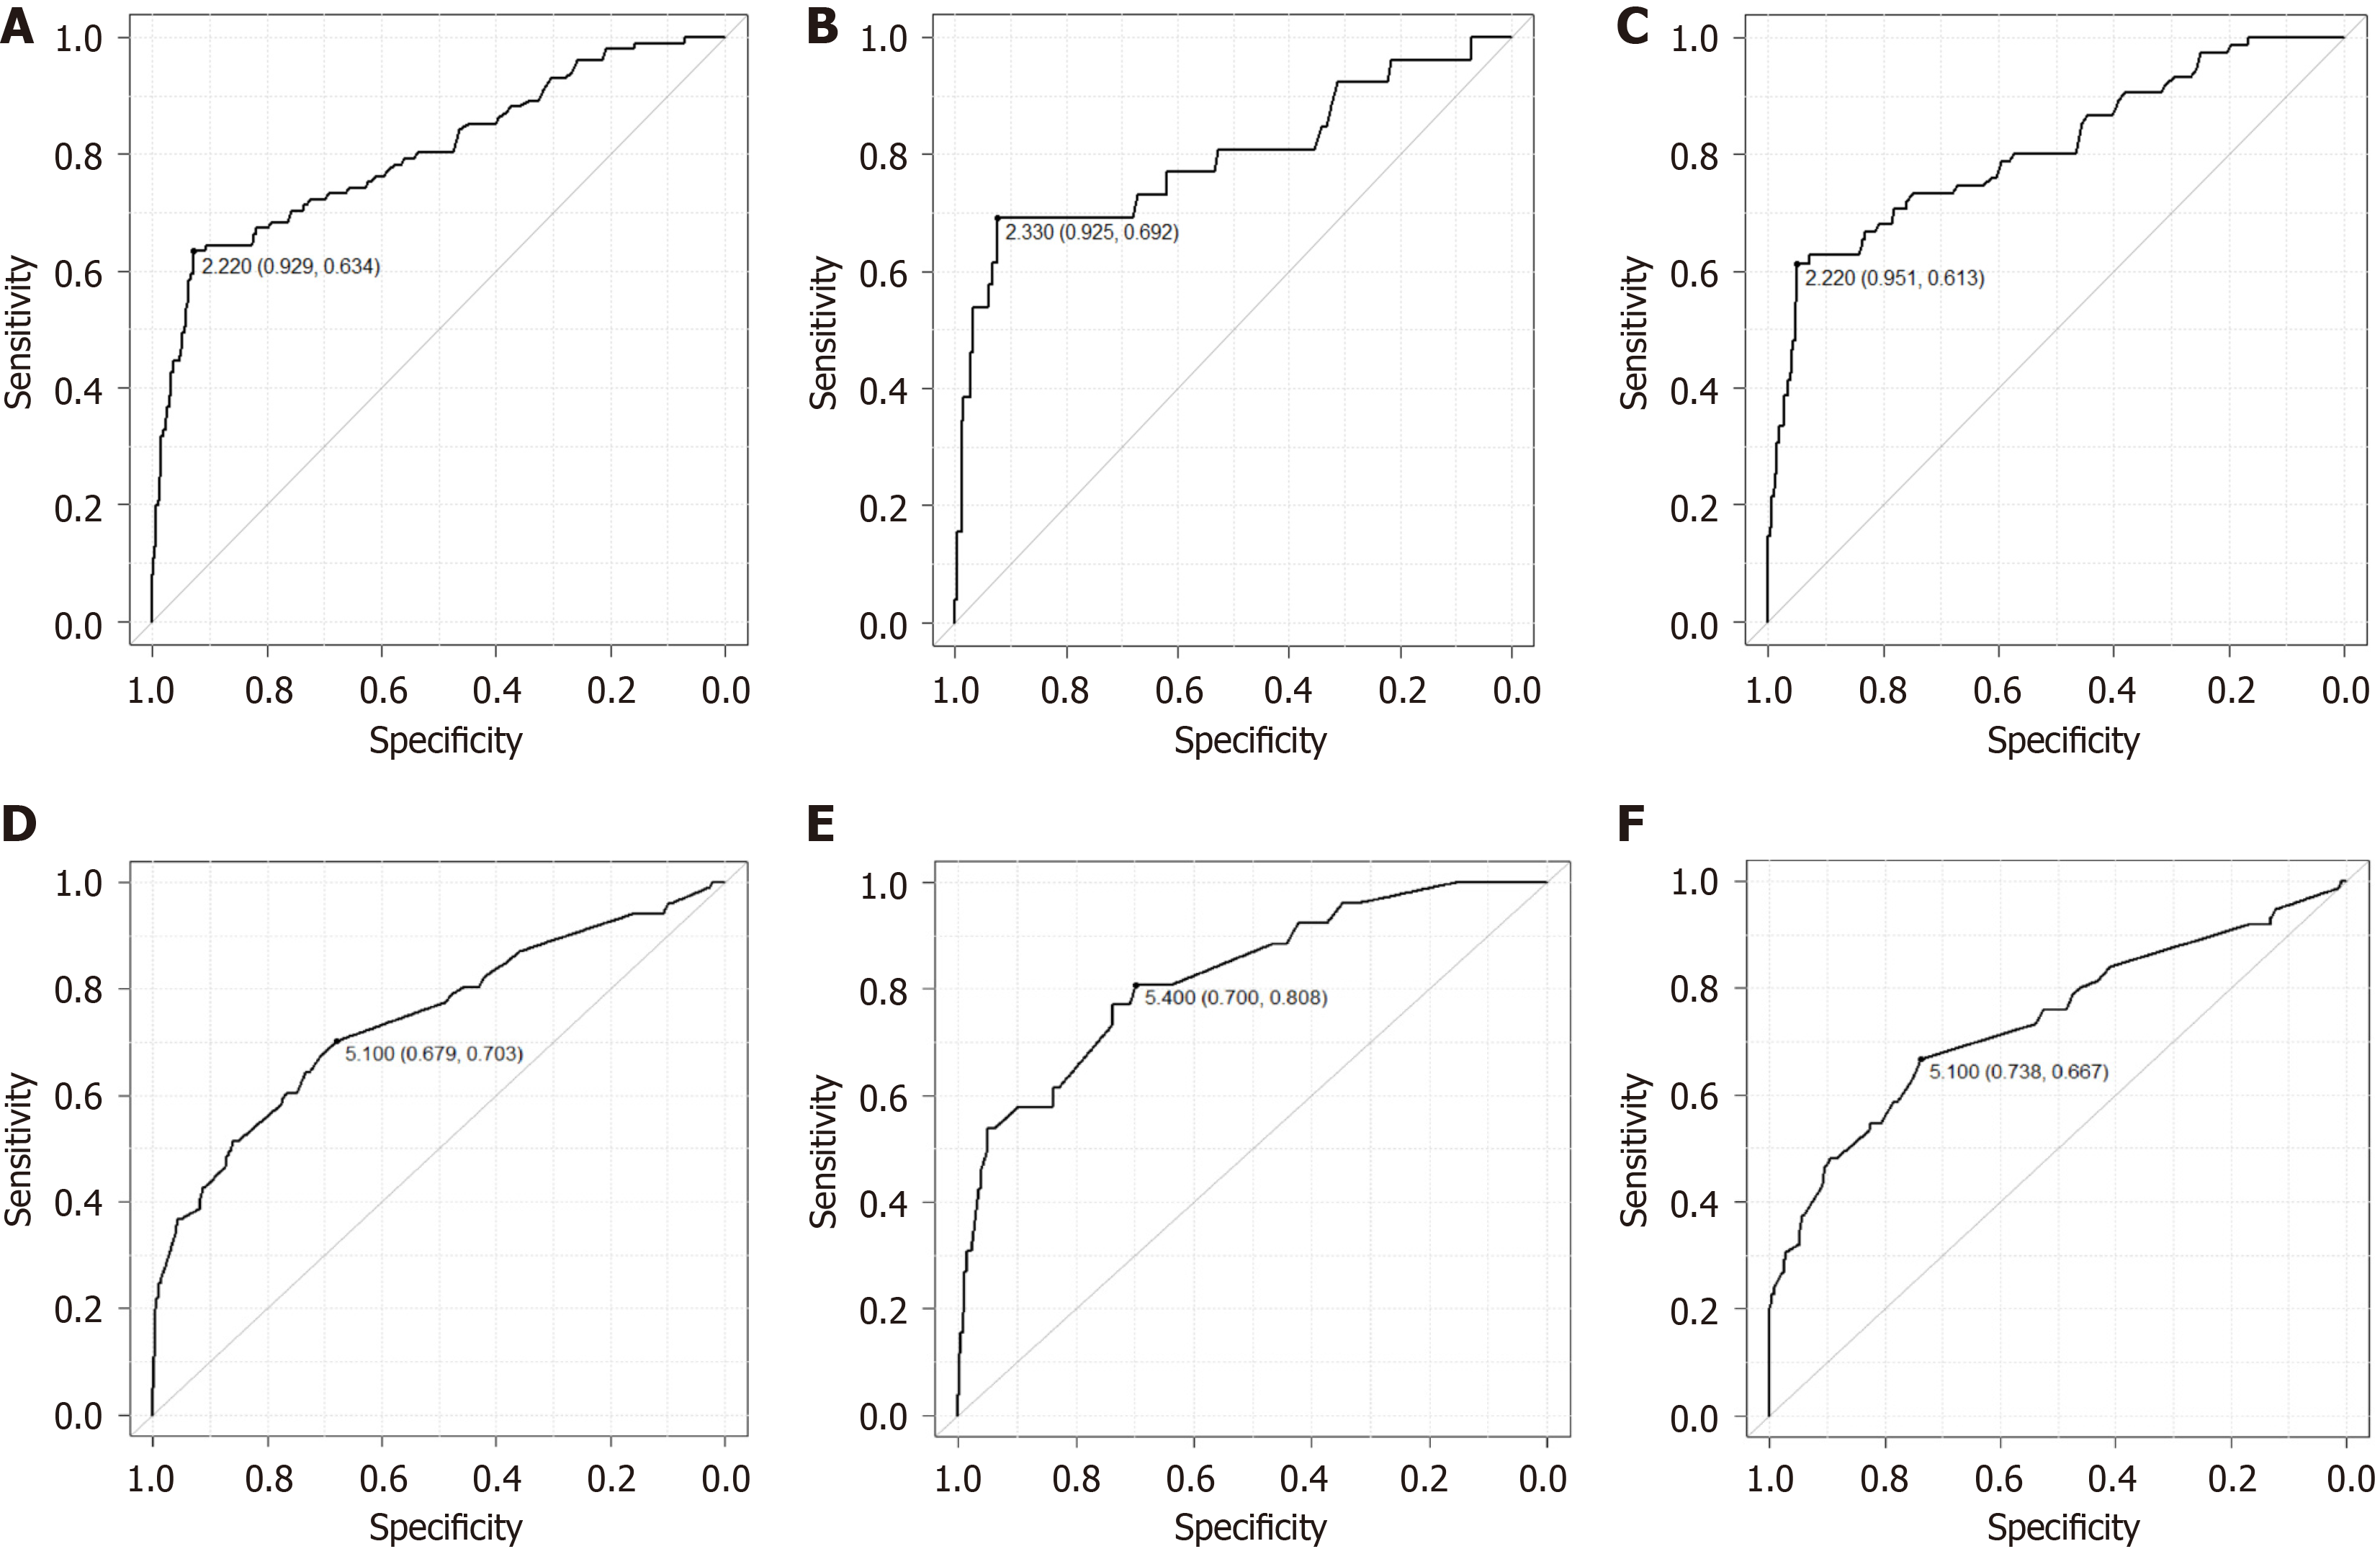
Figure 4 Receiver operating characteristic curves.
A-C: Shear-wave elastography measurements. In the analysis of all lymph nodes, the receiver operating characteristic (ROC) curve shows an area under the curve (AUC) of 0.80 [95% confidence interval (CI): 0.75-0.85] (A); BIn the esophageal cancer (EC) analysis, the ROC curve shows an AUC of 0.79 (95%CI: 0.68-0.91) (B); In the gastric cancer (GC) analysis, the ROC curve shows an AUC of 0.81 (95%CI: 0.75-0.87) (C); D-F: Lymph node sizes and cutoff values. In the analysis of all lymph nodes, the cutoff value is calculated as 5.10 mm, with the ROC curve showing an AUC of 0.74 (95%CI: 0.69-0.80) (D); In the EC analysis, the cutoff value is 5.40 mm, with an AUC of 0.83 (95%CI: 0.74-0.91) (E); In the GC analysis, the cut off value is 5.10 mm, with an AUC of 0.74 (95%CI: 0.67-0.81) (F).
- Citation: Suzuki M, Sakurazawa N, Hagiwara N, Kogo H, Haruna T, Ohashi R, Yoshida H. Usefulness of shear-wave elastography for detection of lymph node metastasis in esophageal and gastric cancer. World J Gastrointest Oncol 2025; 17(4): 101925
- URL: https://www.wjgnet.com/1948-5204/full/v17/i4/101925.htm
- DOI: https://dx.doi.org/10.4251/wjgo.v17.i4.101925


