Copyright
©The Author(s) 2025.
World J Gastrointest Oncol. Mar 15, 2025; 17(3): 98844
Published online Mar 15, 2025. doi: 10.4251/wjgo.v17.i3.98844
Published online Mar 15, 2025. doi: 10.4251/wjgo.v17.i3.98844
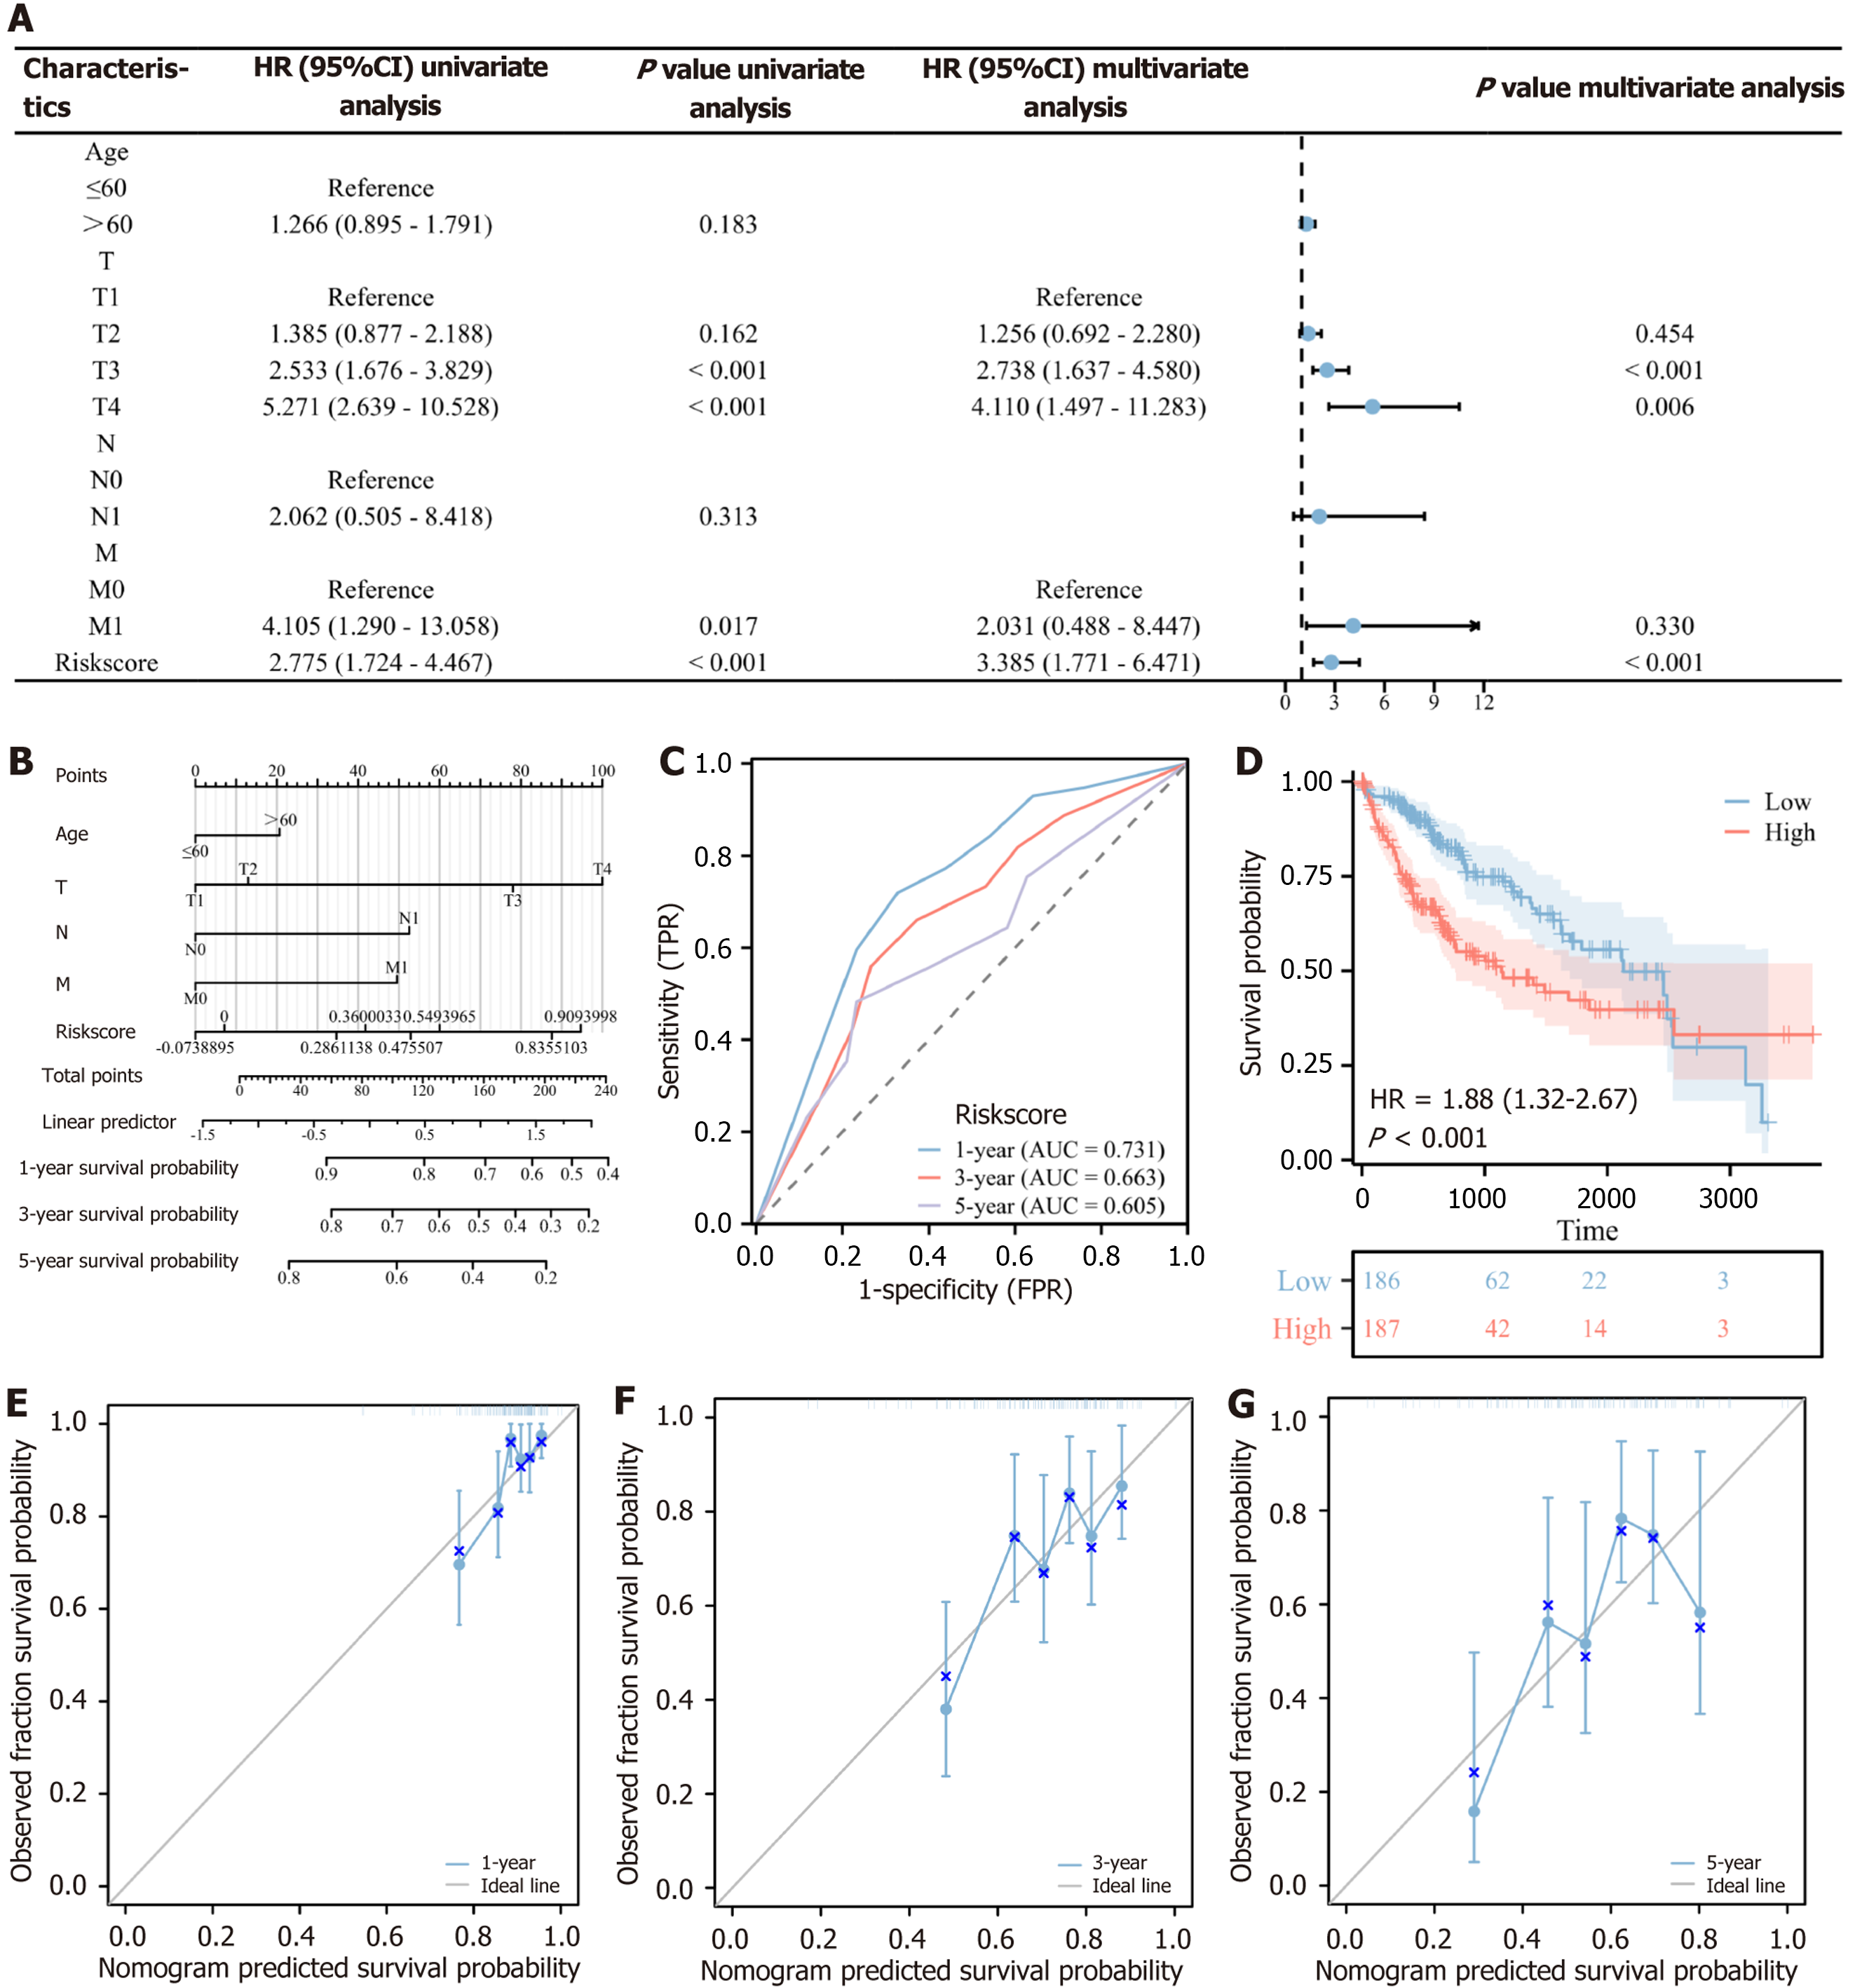
Figure 4 Construction and evaluation of the risk assessment system for chlorogenic acid intervention targets and nomogram.
A: Forest plot of univariate and multivariate Cox regression analysis of chlorogenic acid intervention targets; B: Construction of nomogram integrating risk score and clinical information; C: Time-receiver operating characteristic curve of the risk assessment system; D: Kaplan-Meier curve comparing the survival between high- and low-risk groups; E-G: Calibration plots of the nomogram for 1-year, 3-year, and 5-year survival (mean ± SD, n = 374). HR: Hazard ratios; CI: Confidence intervals; T: Tumor; N: Node; M: Metastasis; TPR: True positive rate.
- Citation: Wu L, Chen HY, Zhang JT, Yang RY, Wang ZB, Xue PS, Peng W, Li KX, Gao WH, Zeng PH. Chlorogenic acid induces hepatocellular carcinoma cell ferroptosis via PTGS2/AKR1C3/GPX4 axis-mediated reprogramming of arachidonic acid metabolism. World J Gastrointest Oncol 2025; 17(3): 98844
- URL: https://www.wjgnet.com/1948-5204/full/v17/i3/98844.htm
- DOI: https://dx.doi.org/10.4251/wjgo.v17.i3.98844


