Copyright
©The Author(s) 2025.
World J Gastrointest Oncol. Mar 15, 2025; 17(3): 98844
Published online Mar 15, 2025. doi: 10.4251/wjgo.v17.i3.98844
Published online Mar 15, 2025. doi: 10.4251/wjgo.v17.i3.98844
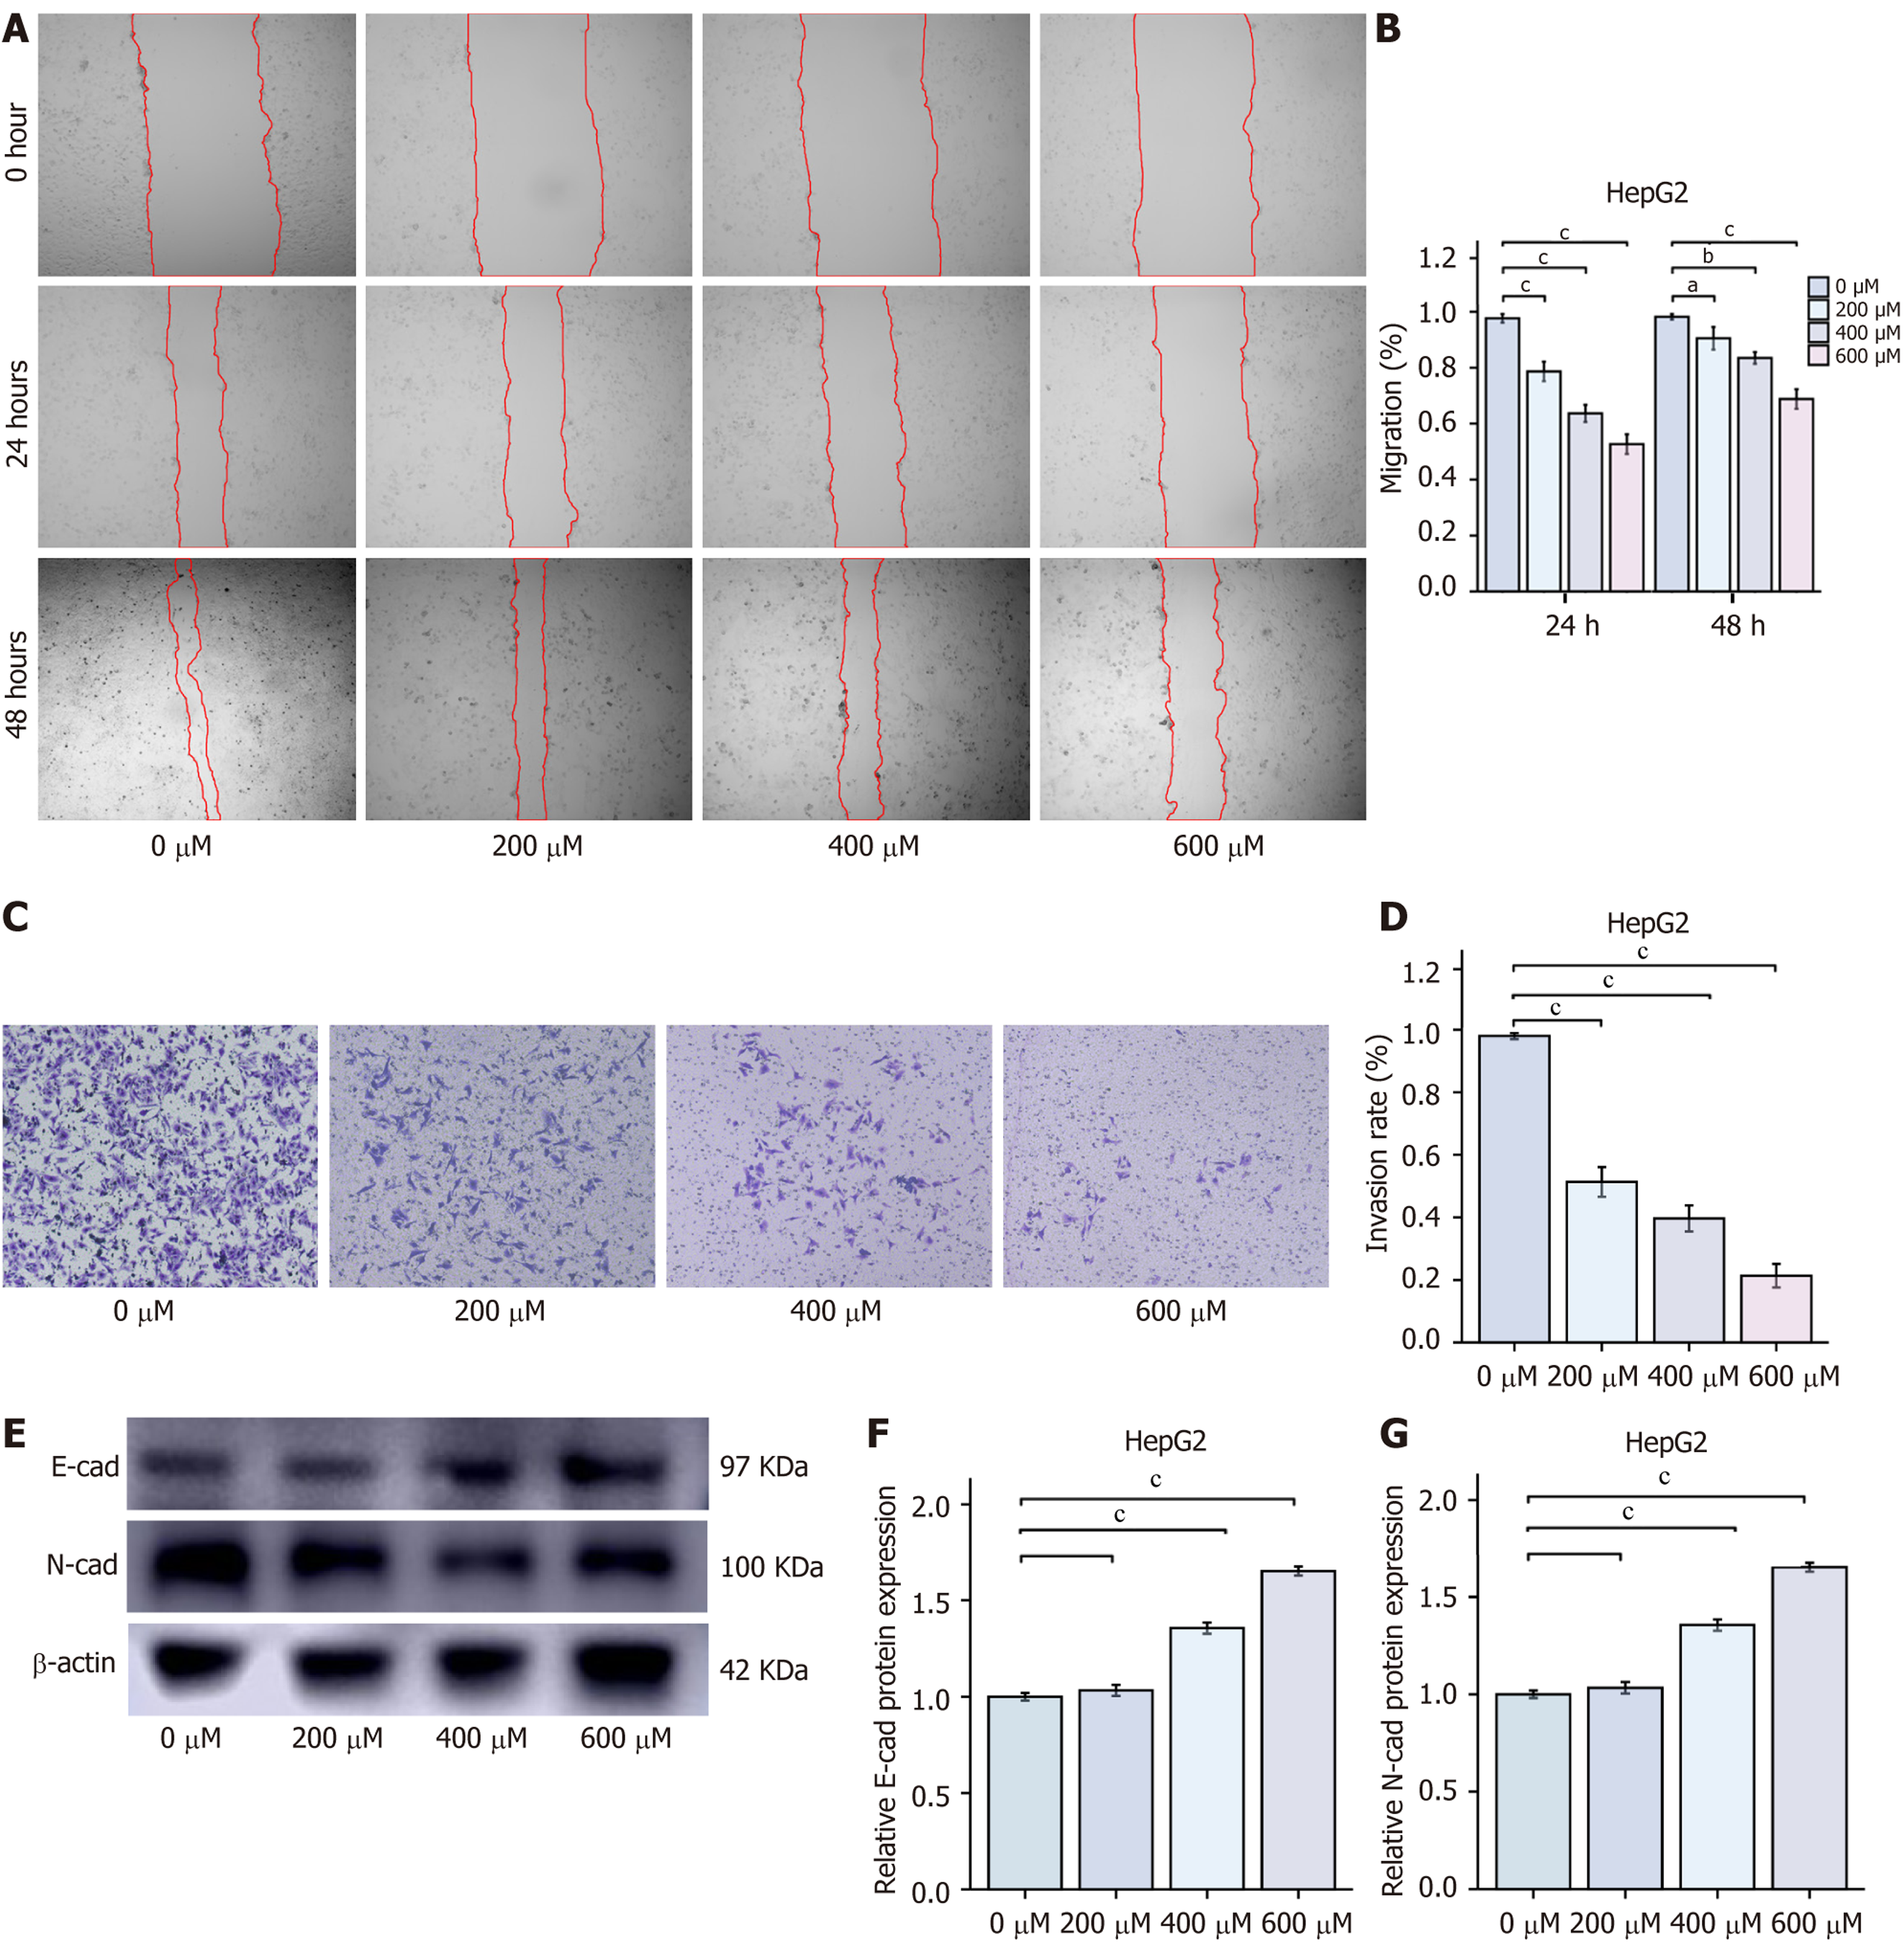
Figure 2 Chlorogenic acid inhibits HepG2 cell migration and invasion (mean ± SD, n = 3).
A and B: Wound healing assay to evaluate the migration ability of HepG2 cells; C and D: Transwell assay (× 100 magnification) to evaluate the invasion ability of HepG2 cells; E-G: Western blot analysis of E-cadherin and N-cadherin protein levels. aP < 0.05, bP < 0.01, and cP < 0.001 compared to the 0 μmol chlorogenic acid group. E-cad: E-cadherin; N-cad: N-cadherin.
- Citation: Wu L, Chen HY, Zhang JT, Yang RY, Wang ZB, Xue PS, Peng W, Li KX, Gao WH, Zeng PH. Chlorogenic acid induces hepatocellular carcinoma cell ferroptosis via PTGS2/AKR1C3/GPX4 axis-mediated reprogramming of arachidonic acid metabolism. World J Gastrointest Oncol 2025; 17(3): 98844
- URL: https://www.wjgnet.com/1948-5204/full/v17/i3/98844.htm
- DOI: https://dx.doi.org/10.4251/wjgo.v17.i3.98844


