Copyright
©The Author(s) 2025.
World J Gastrointest Oncol. Mar 15, 2025; 17(3): 103450
Published online Mar 15, 2025. doi: 10.4251/wjgo.v17.i3.103450
Published online Mar 15, 2025. doi: 10.4251/wjgo.v17.i3.103450
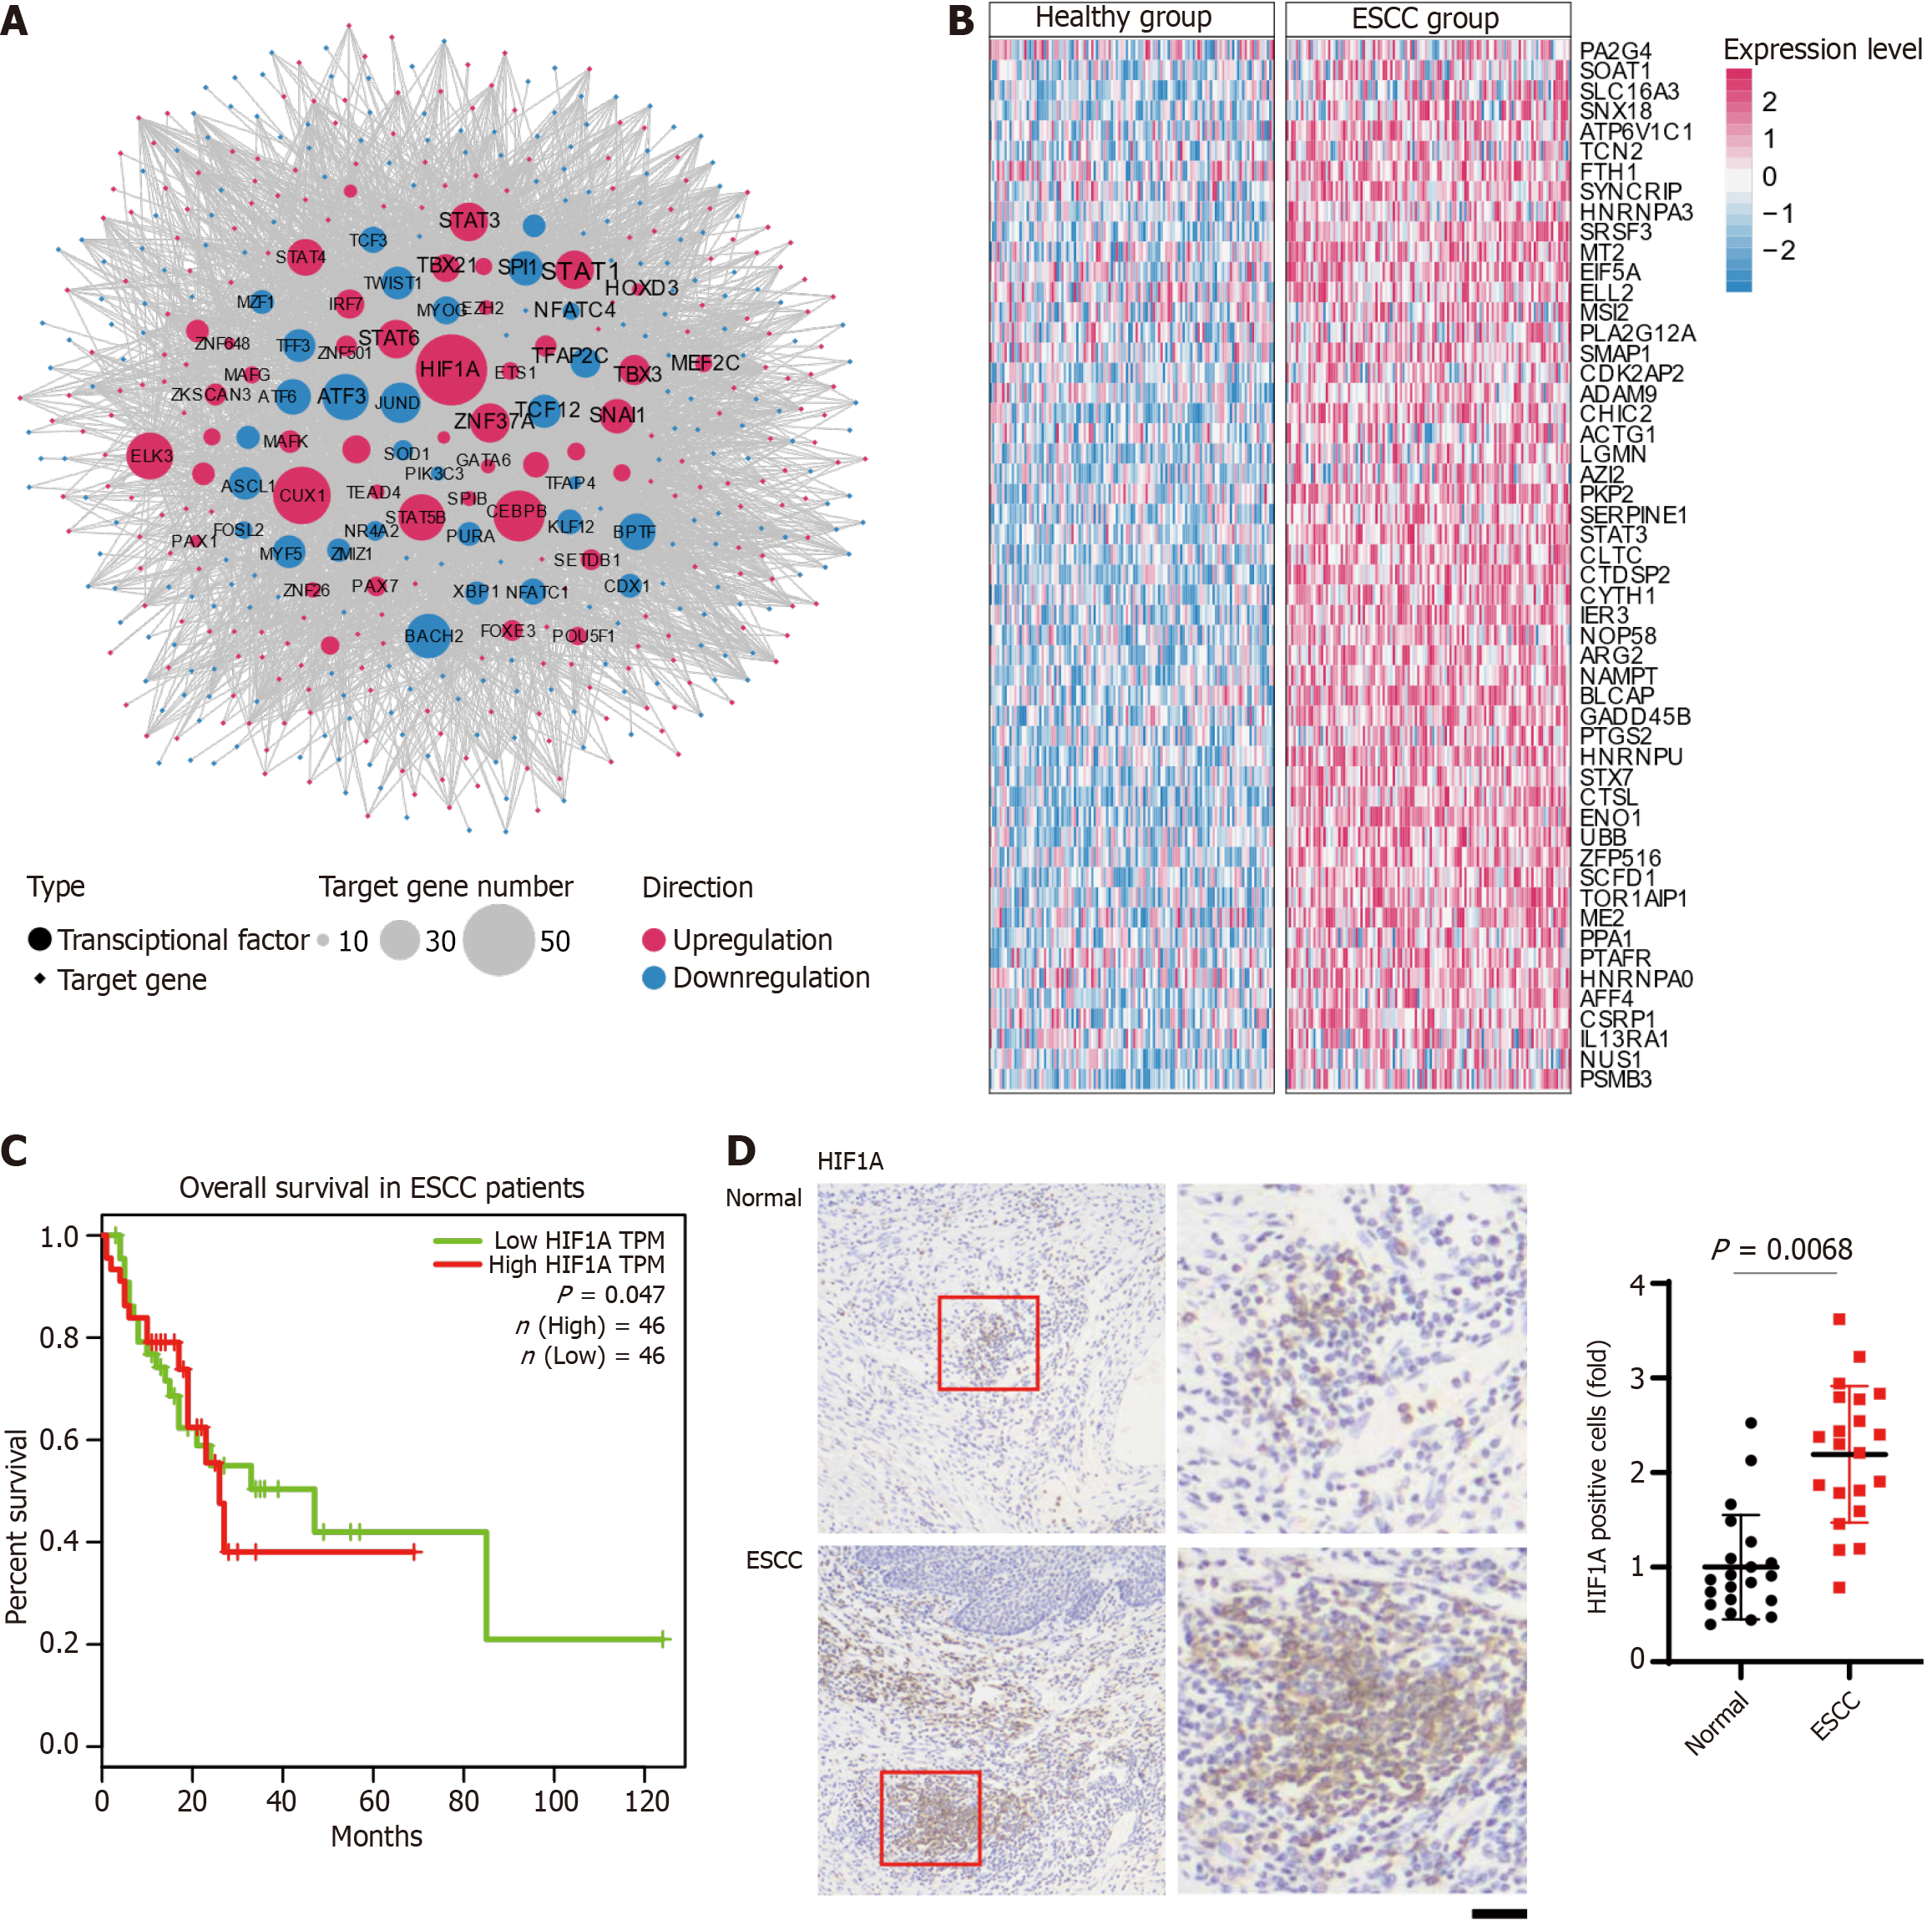
Figure 2 Analysis of transcription factor regulatory networks and gene expression patterns in esophageal squamous-cell carcinoma.
A: Network diagram illustrating the transcription factor (TFs) regulatory landscape in esophageal squamous-cell carcinoma (ESCC). Circular nodes represent TFs, while diamond-shaped nodes represent their target genes. The network includes 31 upregulated TFs (red circular nodes) and 43 downregulated TFs (blue circular nodes). The size of each circular node reflects the number of target genes regulated, with larger nodes indicating a greater number of downstream targets. Similarly, target genes (diamond-shaped nodes) are color-coded to indicate expression changes, with red representing upregulation and blue representing downregulation. Edges indicate regulatory interactions between TFs and their target genes, emphasizing the extensive and interconnected regulatory network involved in ESCC progression; B: Heatmap illustrating the expression levels of downstream target genes regulated by hypoxia-inducible factor 1-alpha (HIF1A) in healthy (left panel) and ESCC (right panel) tissue samples. Each row corresponds to an individual target gene, while each column represents a sample. Gene expression levels are normalized and presented as z-scores, with red representing high expression and blue representing low expression. The heatmap demonstrates distinct differences in the expression profiles of HIF1A target genes between the healthy and ESCC groups, underscoring the pivotal role of HIF1A in modulating gene expression during ESCC progression; C: Kaplan-Meier survival curves illustrating the impact of HIF1A expression on overall survival in patients with ESCC. Patients are grouped into high HIF1A transcript per million (TPM) (red line) and low HIF1A TPM (green line). The survival probability is plotted over a period of 120 months; D: Immunohistochemical analysis of HIF1A protein expression in 21 paired ESCC patient tissues. Scale bar = 25um. ESCC: Esophageal squamous-cell carcinoma; HIF1A: Hypoxia-inducible factor 1-alpha.
- Citation: Chen X, Liu HY, Zhou WB, Zhang LL, Huang J, Bao DW. Hypoxia-inducible factor 1-alpha and lactate dehydrogenase-A axis in metabolic changes and aggression in esophageal squamous-cell carcinoma. World J Gastrointest Oncol 2025; 17(3): 103450
- URL: https://www.wjgnet.com/1948-5204/full/v17/i3/103450.htm
- DOI: https://dx.doi.org/10.4251/wjgo.v17.i3.103450


