Copyright
©The Author(s) 2025.
World J Gastrointest Oncol. Mar 15, 2025; 17(3): 102804
Published online Mar 15, 2025. doi: 10.4251/wjgo.v17.i3.102804
Published online Mar 15, 2025. doi: 10.4251/wjgo.v17.i3.102804
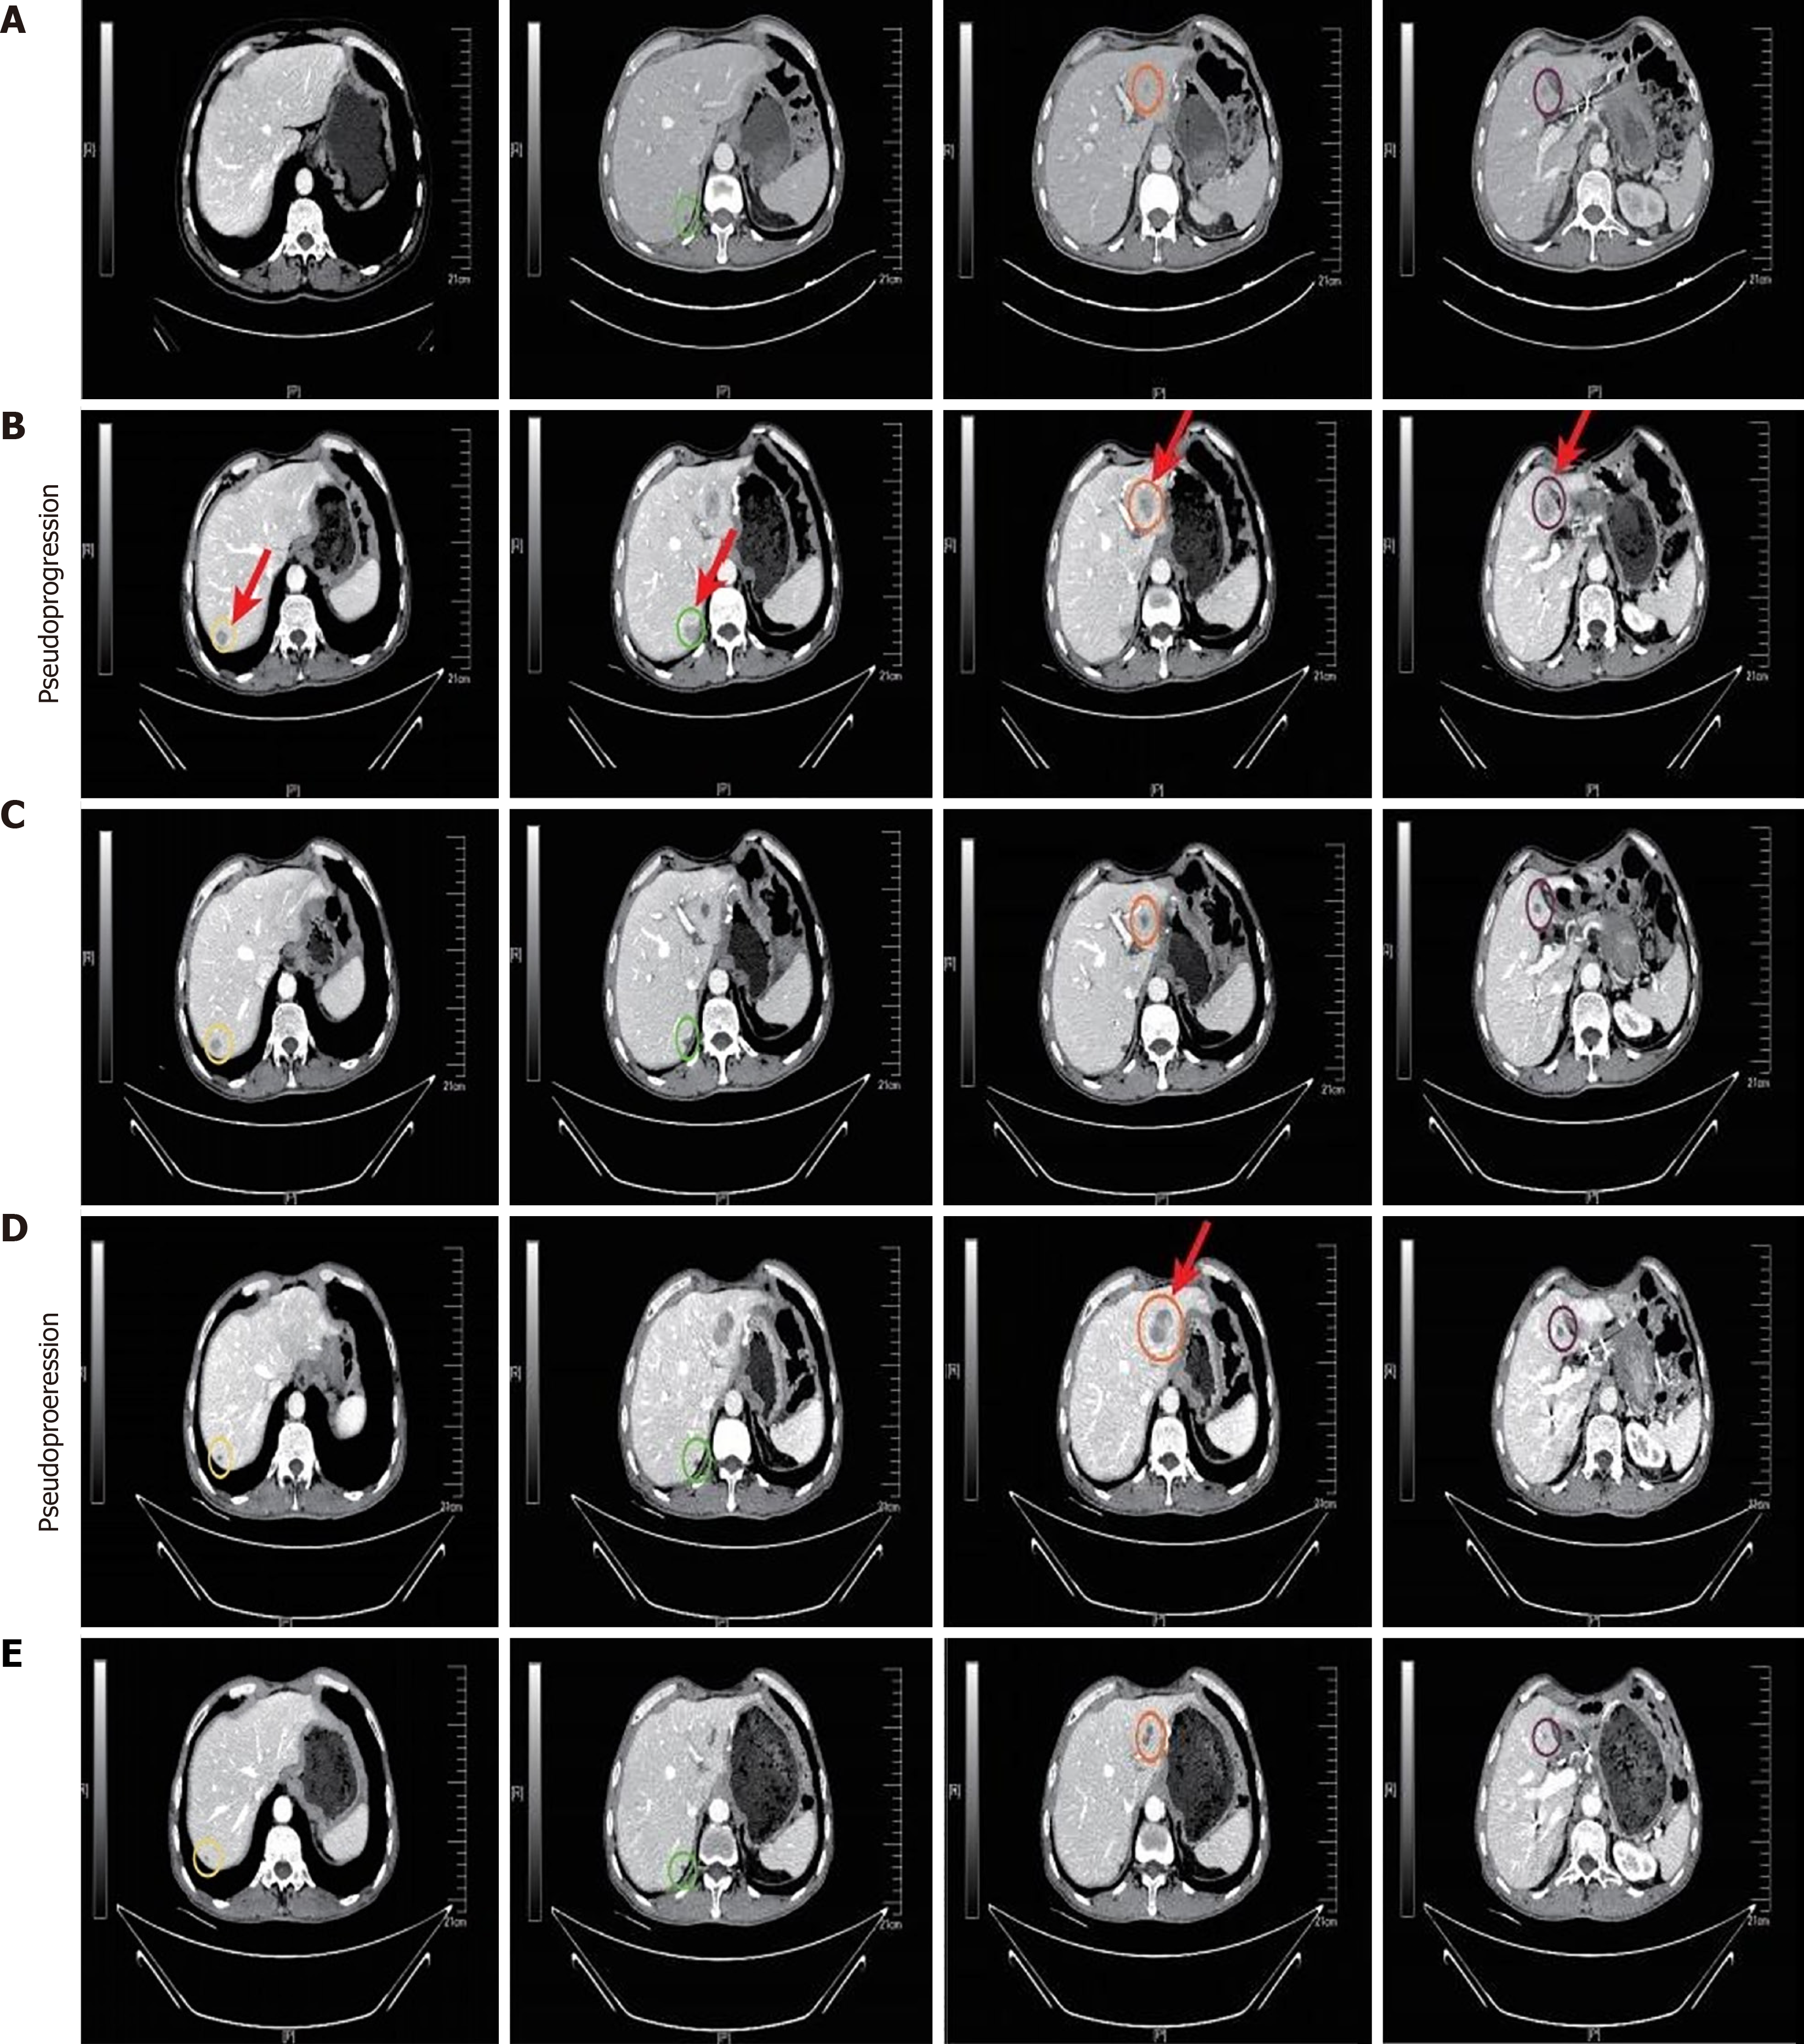
Figure 2 Serial computed tomography images.
A: Images of the abdomen with recurrence; B: Images taken during the first pseudoprogression (PsP) episode of liver lesions after two cycles of teprotumumab (240 mg q3w) combined with sulfatinib (300 mg/day); C: Images of the reduction of the liver lesion after two cycles of treatment; D: Images of the enlarged liver lesion during the second PsP episode after six months of treatment with teprotumumab (240 mg q3w) combined with sulfatinib (300 mg/day); E: Images of the decrease in liver lesion after a subsequent one cycle of treatment.
- Citation: Mou YH, Zhang J, Shen H, Yu J, Han L, Li H, Li QF. Multiple pseudoprogressions during ongoing immunotherapy-based treatment of advanced gastric neuroendocrine carcinoma: A case report and review of literature. World J Gastrointest Oncol 2025; 17(3): 102804
- URL: https://www.wjgnet.com/1948-5204/full/v17/i3/102804.htm
- DOI: https://dx.doi.org/10.4251/wjgo.v17.i3.102804


