Copyright
©The Author(s) 2025.
World J Gastrointest Oncol. Mar 15, 2025; 17(3): 102111
Published online Mar 15, 2025. doi: 10.4251/wjgo.v17.i3.102111
Published online Mar 15, 2025. doi: 10.4251/wjgo.v17.i3.102111
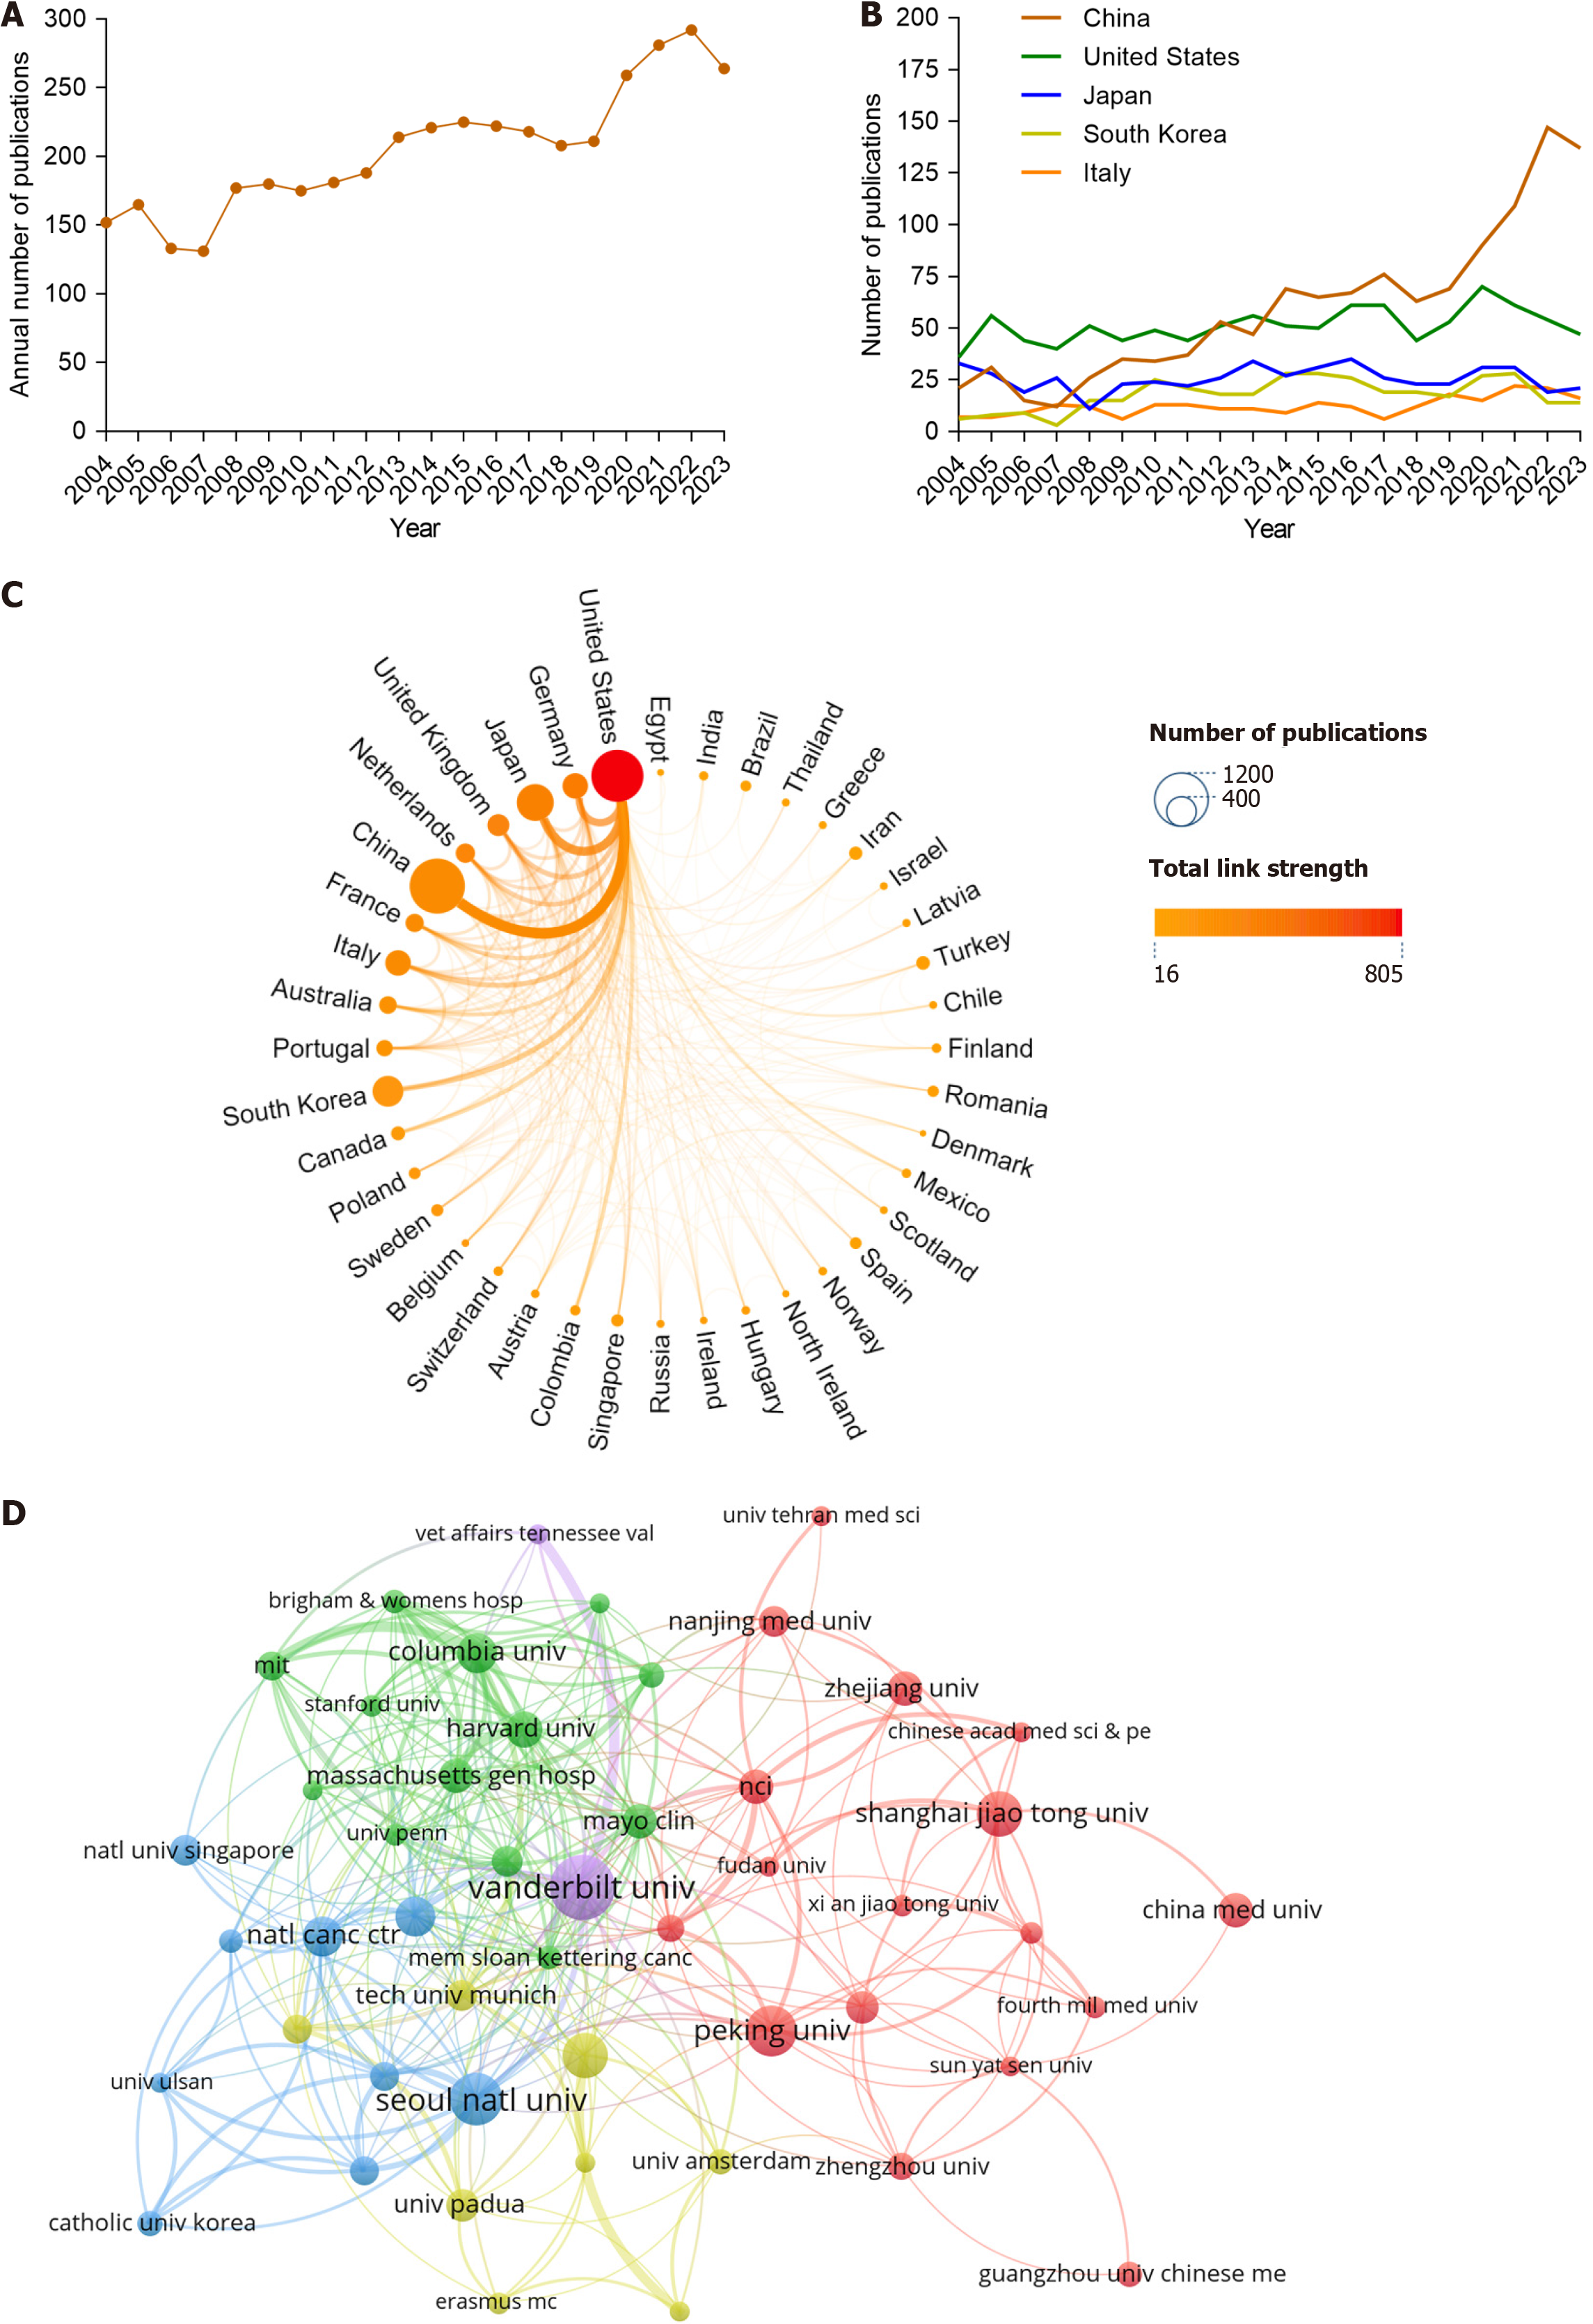
Figure 2 Quantitative analysis of publication and the co-authorship map of countries/regions and institutions.
A: Annual number of publications for precancerous lesions of gastric cancer; B: Annual number of publications in the top 5 countries/regions; C: Co-authorship map of countries/regions. Each node represents a country/region, with the node size corresponding to the number of publications from that location. The connections between nodes represent collaborations, while the intensity of the color reflects the total link strength; D: Co-authorship map of institutions. The nodes in the network map represent institutions, and the size of each node is proportional to the number of publications. The thickness of the connecting lines between nodes indicates the strength of the co-authorship relationships, with colors indicating different clusters.
- Citation: Jia YP, Liu DC, Cao TL, Jiang HZ, Li T, Li Y, Ding X. Advances and global trends of precancerous lesions of gastric cancer: A bibliometric analysis. World J Gastrointest Oncol 2025; 17(3): 102111
- URL: https://www.wjgnet.com/1948-5204/full/v17/i3/102111.htm
- DOI: https://dx.doi.org/10.4251/wjgo.v17.i3.102111


