Copyright
©The Author(s) 2025.
World J Gastrointest Oncol. Mar 15, 2025; 17(3): 102083
Published online Mar 15, 2025. doi: 10.4251/wjgo.v17.i3.102083
Published online Mar 15, 2025. doi: 10.4251/wjgo.v17.i3.102083
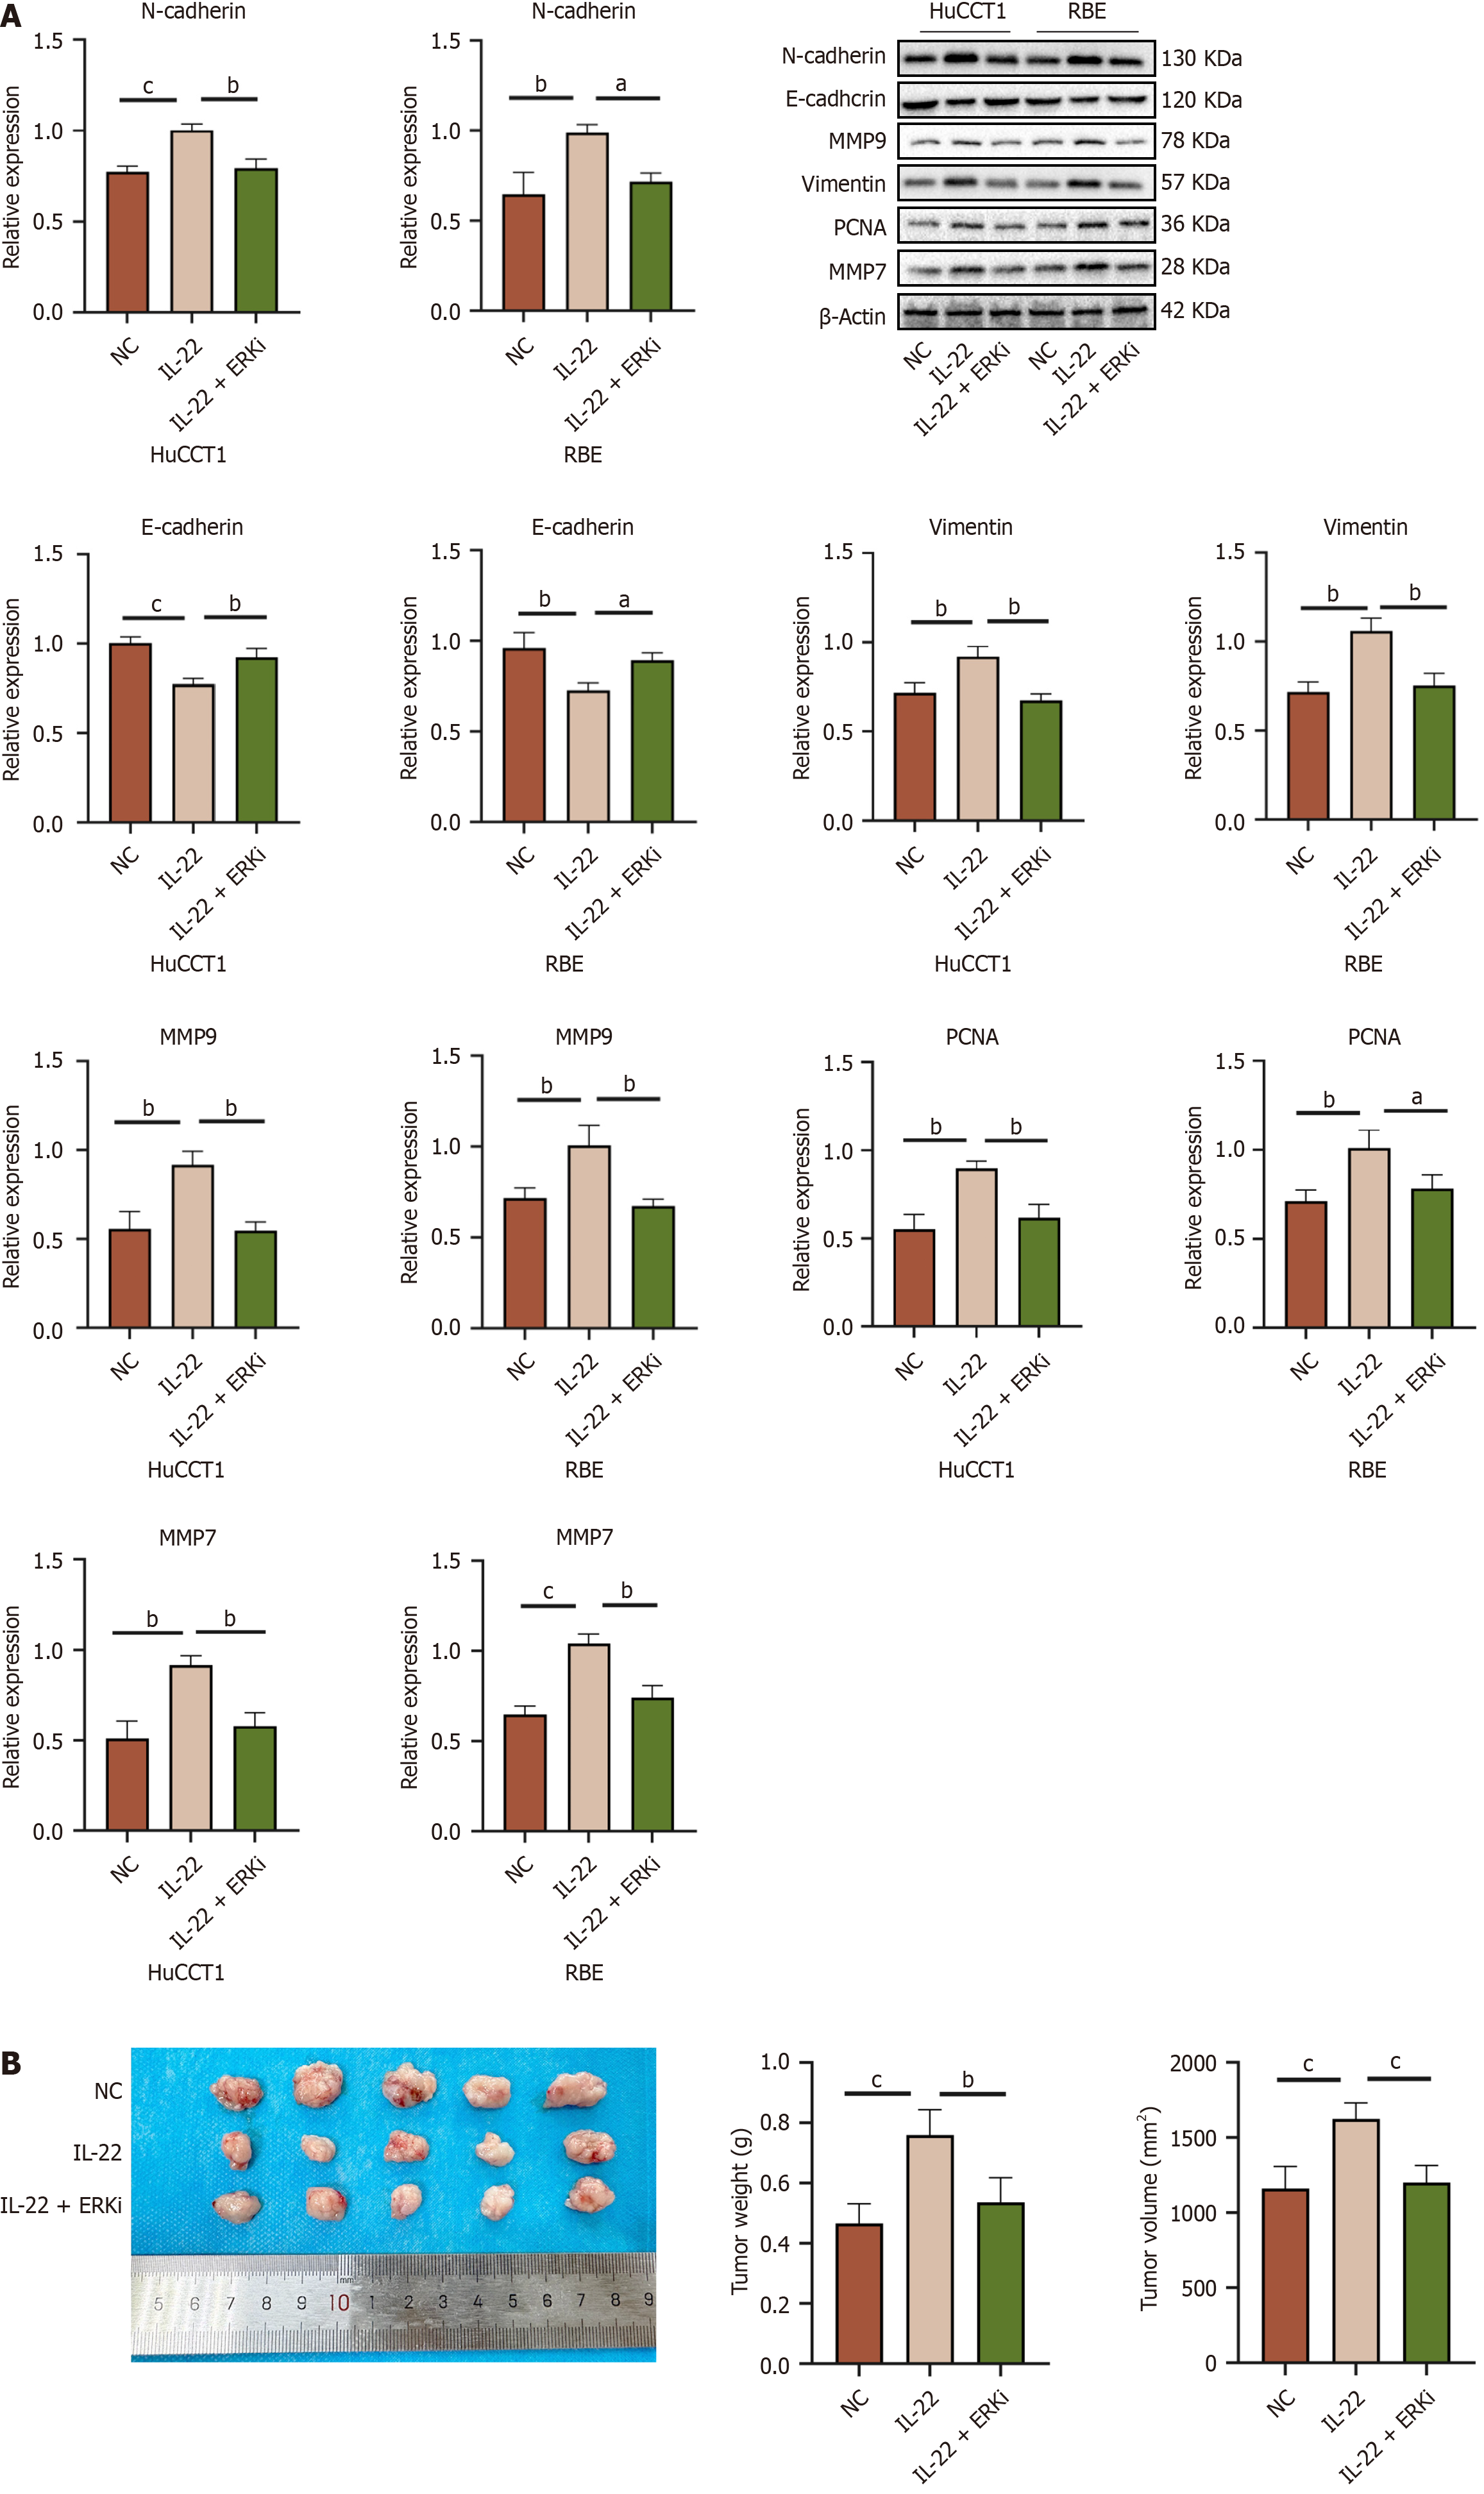
Figure 9 Protein expression levels and in vivo tumor growth of cholangiocarcinoma cells following ERK inhibitor treatment.
A: Western blot expression levels of related oncogenic proteins in HuCCT1 and RBE cells from different treatment groups, along with the results of quantitative analysis of Western blot among the groups; B: Representative images of subcutaneous xenograft tumor tissue samples from nude mice in different treatment groups, along with quantitative analysis results of tumor weight and volume. aP < 0.05, bP < 0.01, cP < 0.001. NC: Negative control.
- Citation: Zhou J, Chen JR, Li JM, Han SQ, Deng XY, Li ZM, Tong W, Wang C, Bai Y, Zhang YM. IL-22/IL-22R1 pathway enhances cholangiocarcinoma progression via ERK1/2 activation. World J Gastrointest Oncol 2025; 17(3): 102083
- URL: https://www.wjgnet.com/1948-5204/full/v17/i3/102083.htm
- DOI: https://dx.doi.org/10.4251/wjgo.v17.i3.102083


