Copyright
©The Author(s) 2025.
World J Gastrointest Oncol. Mar 15, 2025; 17(3): 100997
Published online Mar 15, 2025. doi: 10.4251/wjgo.v17.i3.100997
Published online Mar 15, 2025. doi: 10.4251/wjgo.v17.i3.100997
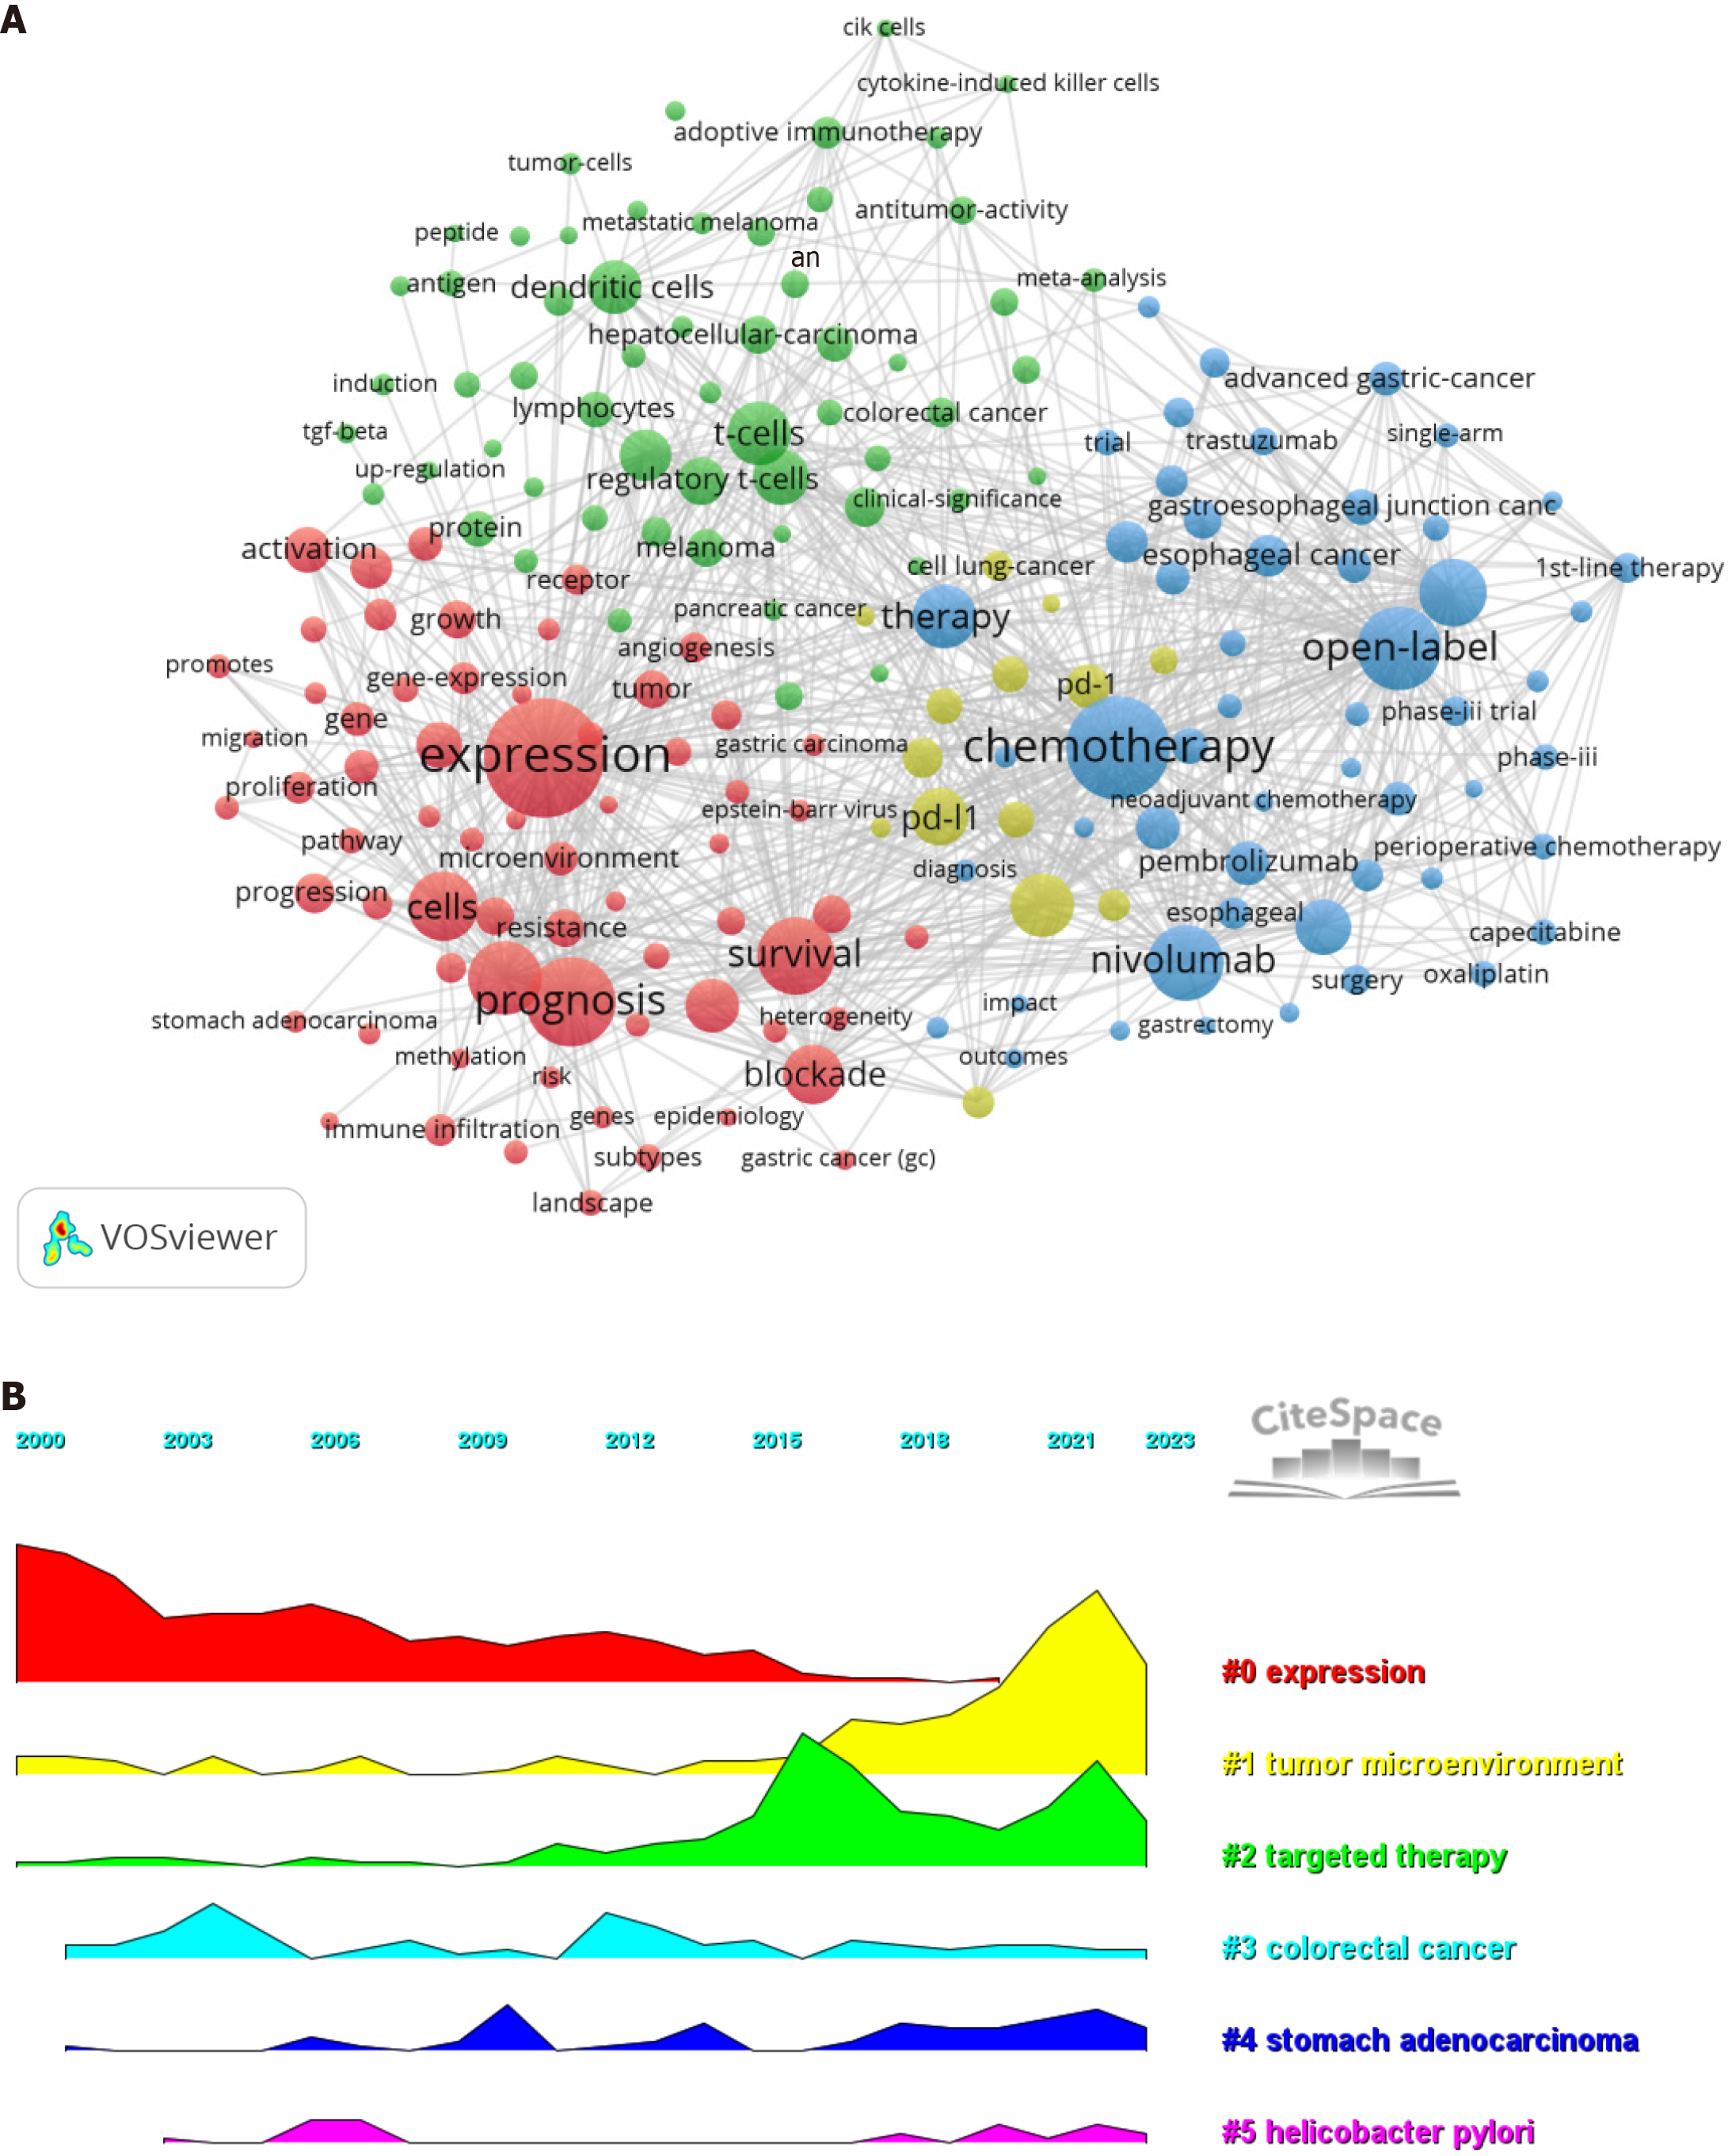
Figure 9 Keyword Analysis.
A: The high-frequency keyword network graph indicates that the most prevalent keyword is "expression", followed by "chemotherapy", "prognosis", and "open-label"; B: The keyword clustering volcano plot clearly illustrates shifts in research hotspots over time.
- Citation: Yuan Z, Wang JH, Cui H, Wang SY, Wei B, Cui JX. Mapping the landscape of gastric cancer immunotherapy: Bibliometric insights into advances and hotspots. World J Gastrointest Oncol 2025; 17(3): 100997
- URL: https://www.wjgnet.com/1948-5204/full/v17/i3/100997.htm
- DOI: https://dx.doi.org/10.4251/wjgo.v17.i3.100997


