Copyright
©The Author(s) 2025.
World J Gastrointest Oncol. Mar 15, 2025; 17(3): 100997
Published online Mar 15, 2025. doi: 10.4251/wjgo.v17.i3.100997
Published online Mar 15, 2025. doi: 10.4251/wjgo.v17.i3.100997
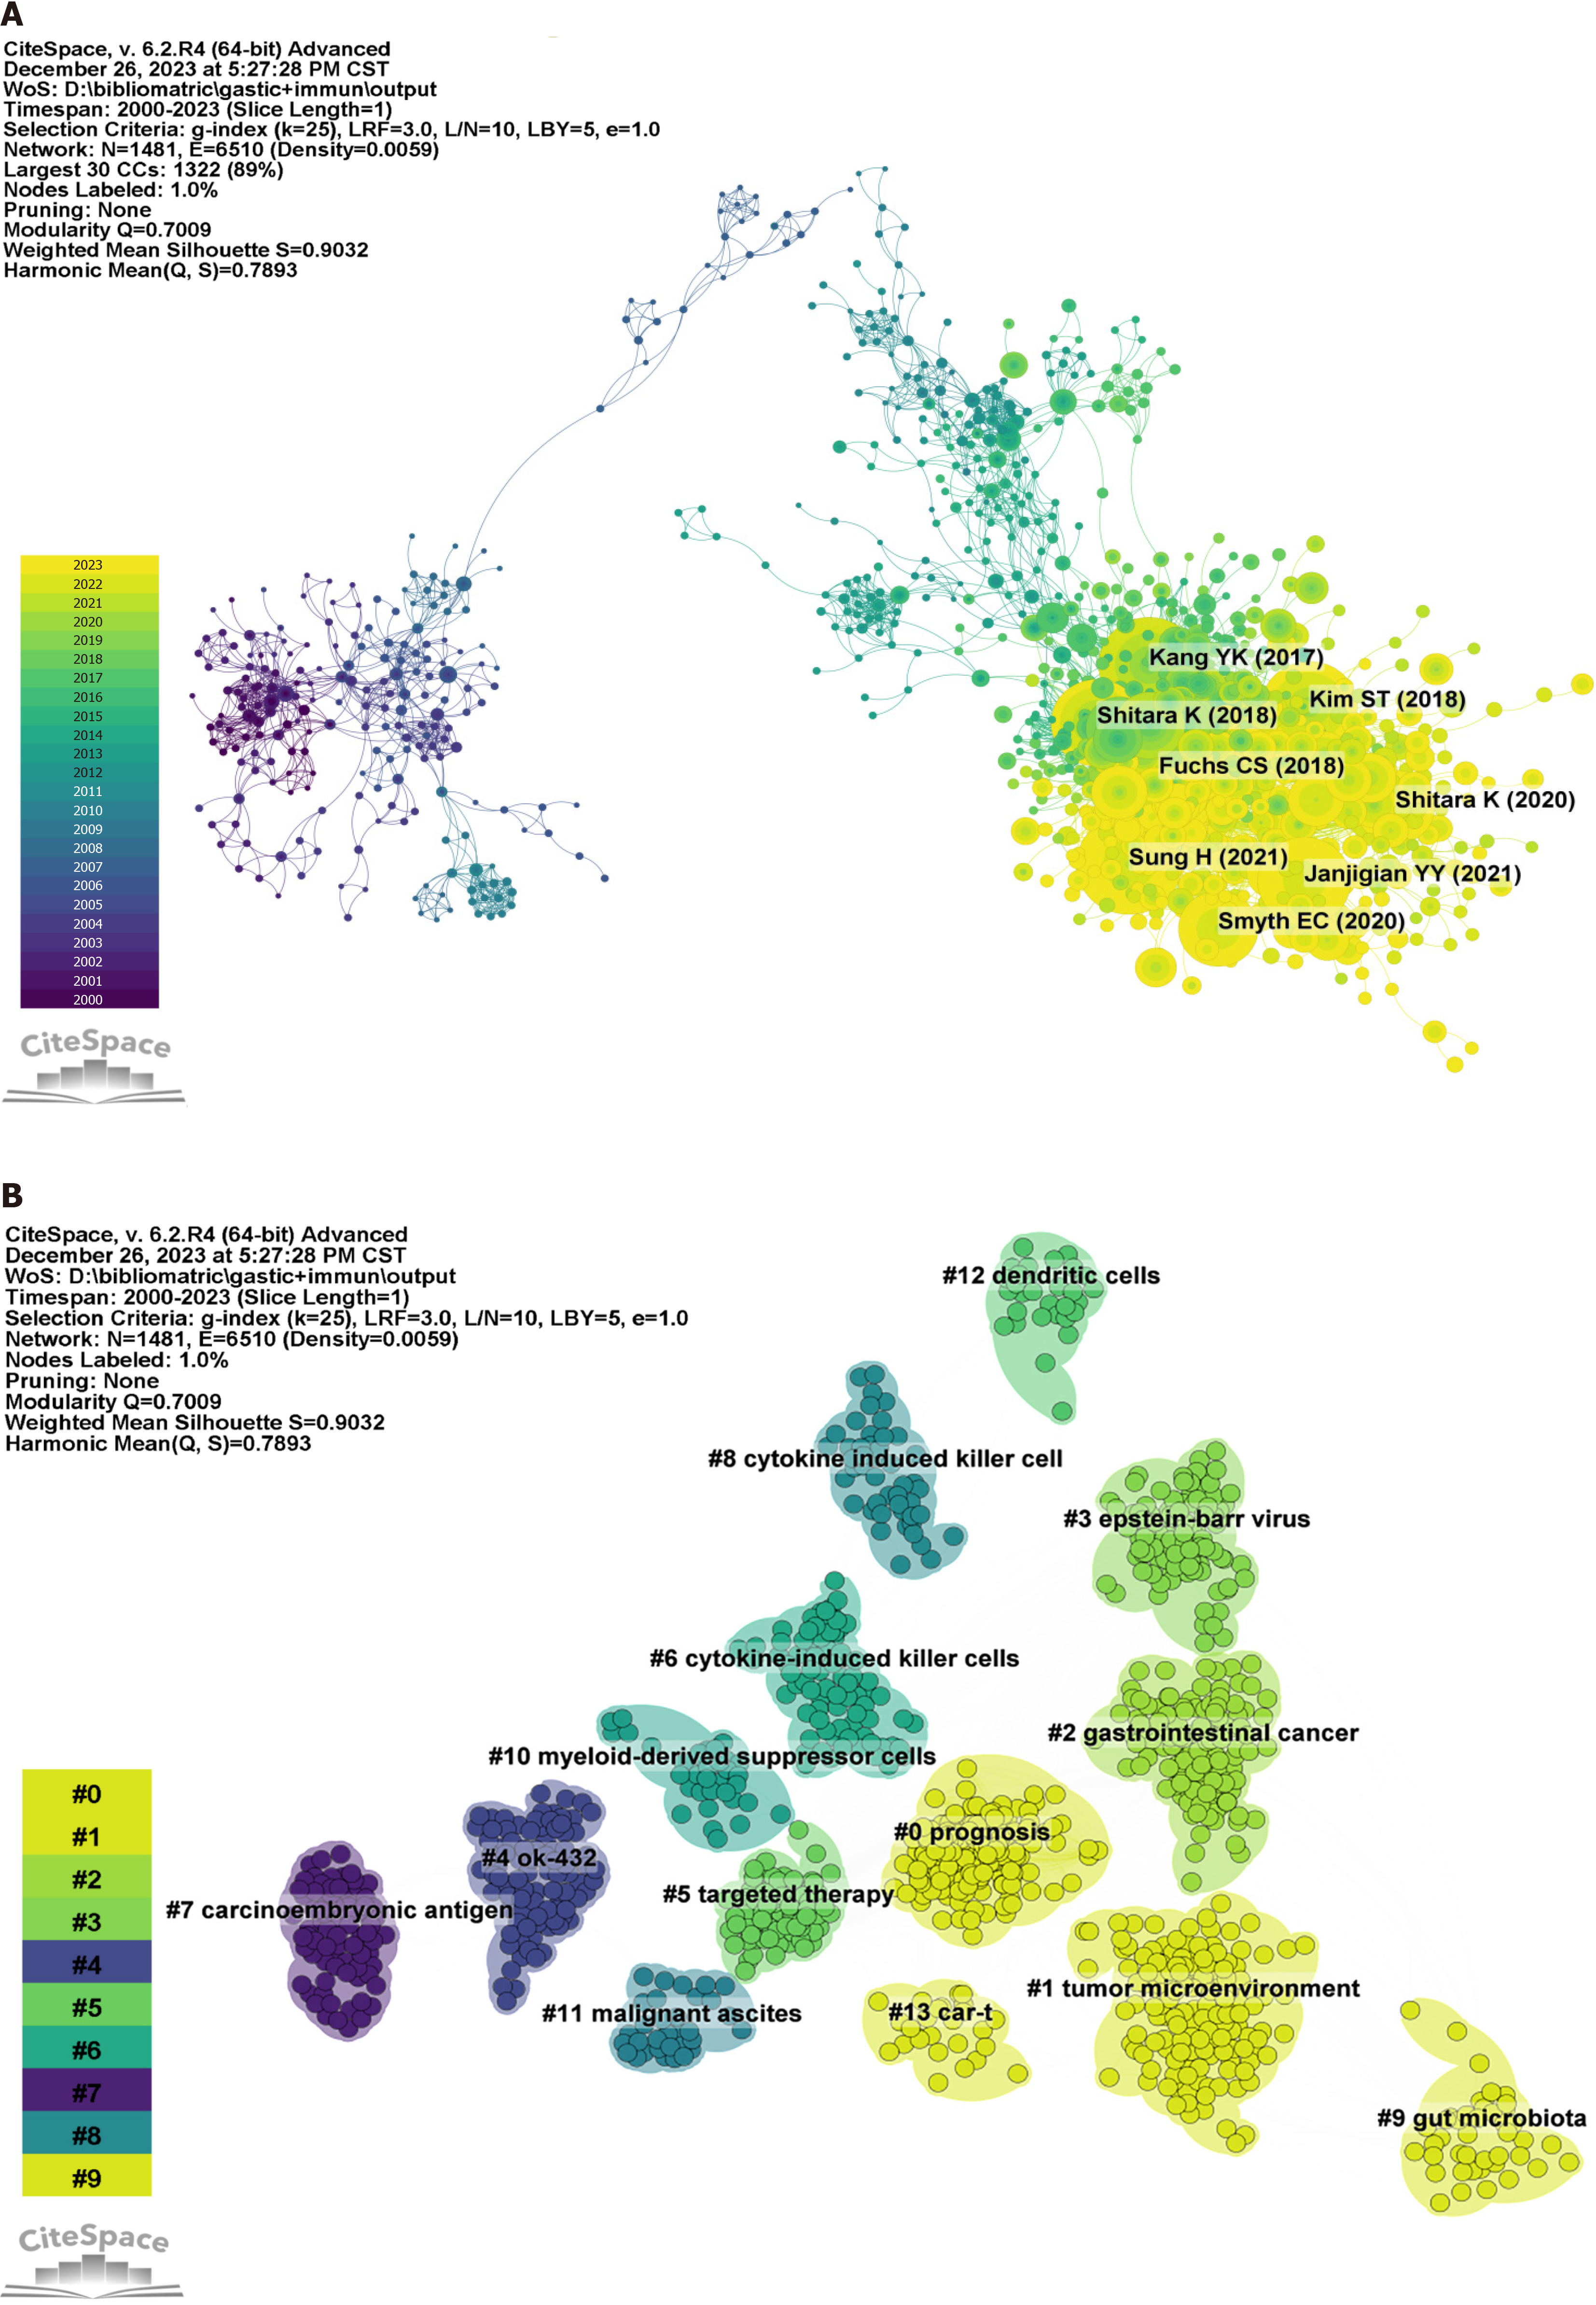
Figure 7 Statistical feature analysis of co-cited literature.
A: Co-cited literature network diagram. Using one year as a time slice, the period spans from 2000 to 2023, featuring a network with 1306 nodes and 4789 links; B: The co-citation clustering diagram conducted a cluster analysis of the topics of the cited literature, displaying 14 clusters.
- Citation: Yuan Z, Wang JH, Cui H, Wang SY, Wei B, Cui JX. Mapping the landscape of gastric cancer immunotherapy: Bibliometric insights into advances and hotspots. World J Gastrointest Oncol 2025; 17(3): 100997
- URL: https://www.wjgnet.com/1948-5204/full/v17/i3/100997.htm
- DOI: https://dx.doi.org/10.4251/wjgo.v17.i3.100997


