Copyright
©The Author(s) 2025.
World J Gastrointest Oncol. Feb 15, 2025; 17(2): 98808
Published online Feb 15, 2025. doi: 10.4251/wjgo.v17.i2.98808
Published online Feb 15, 2025. doi: 10.4251/wjgo.v17.i2.98808
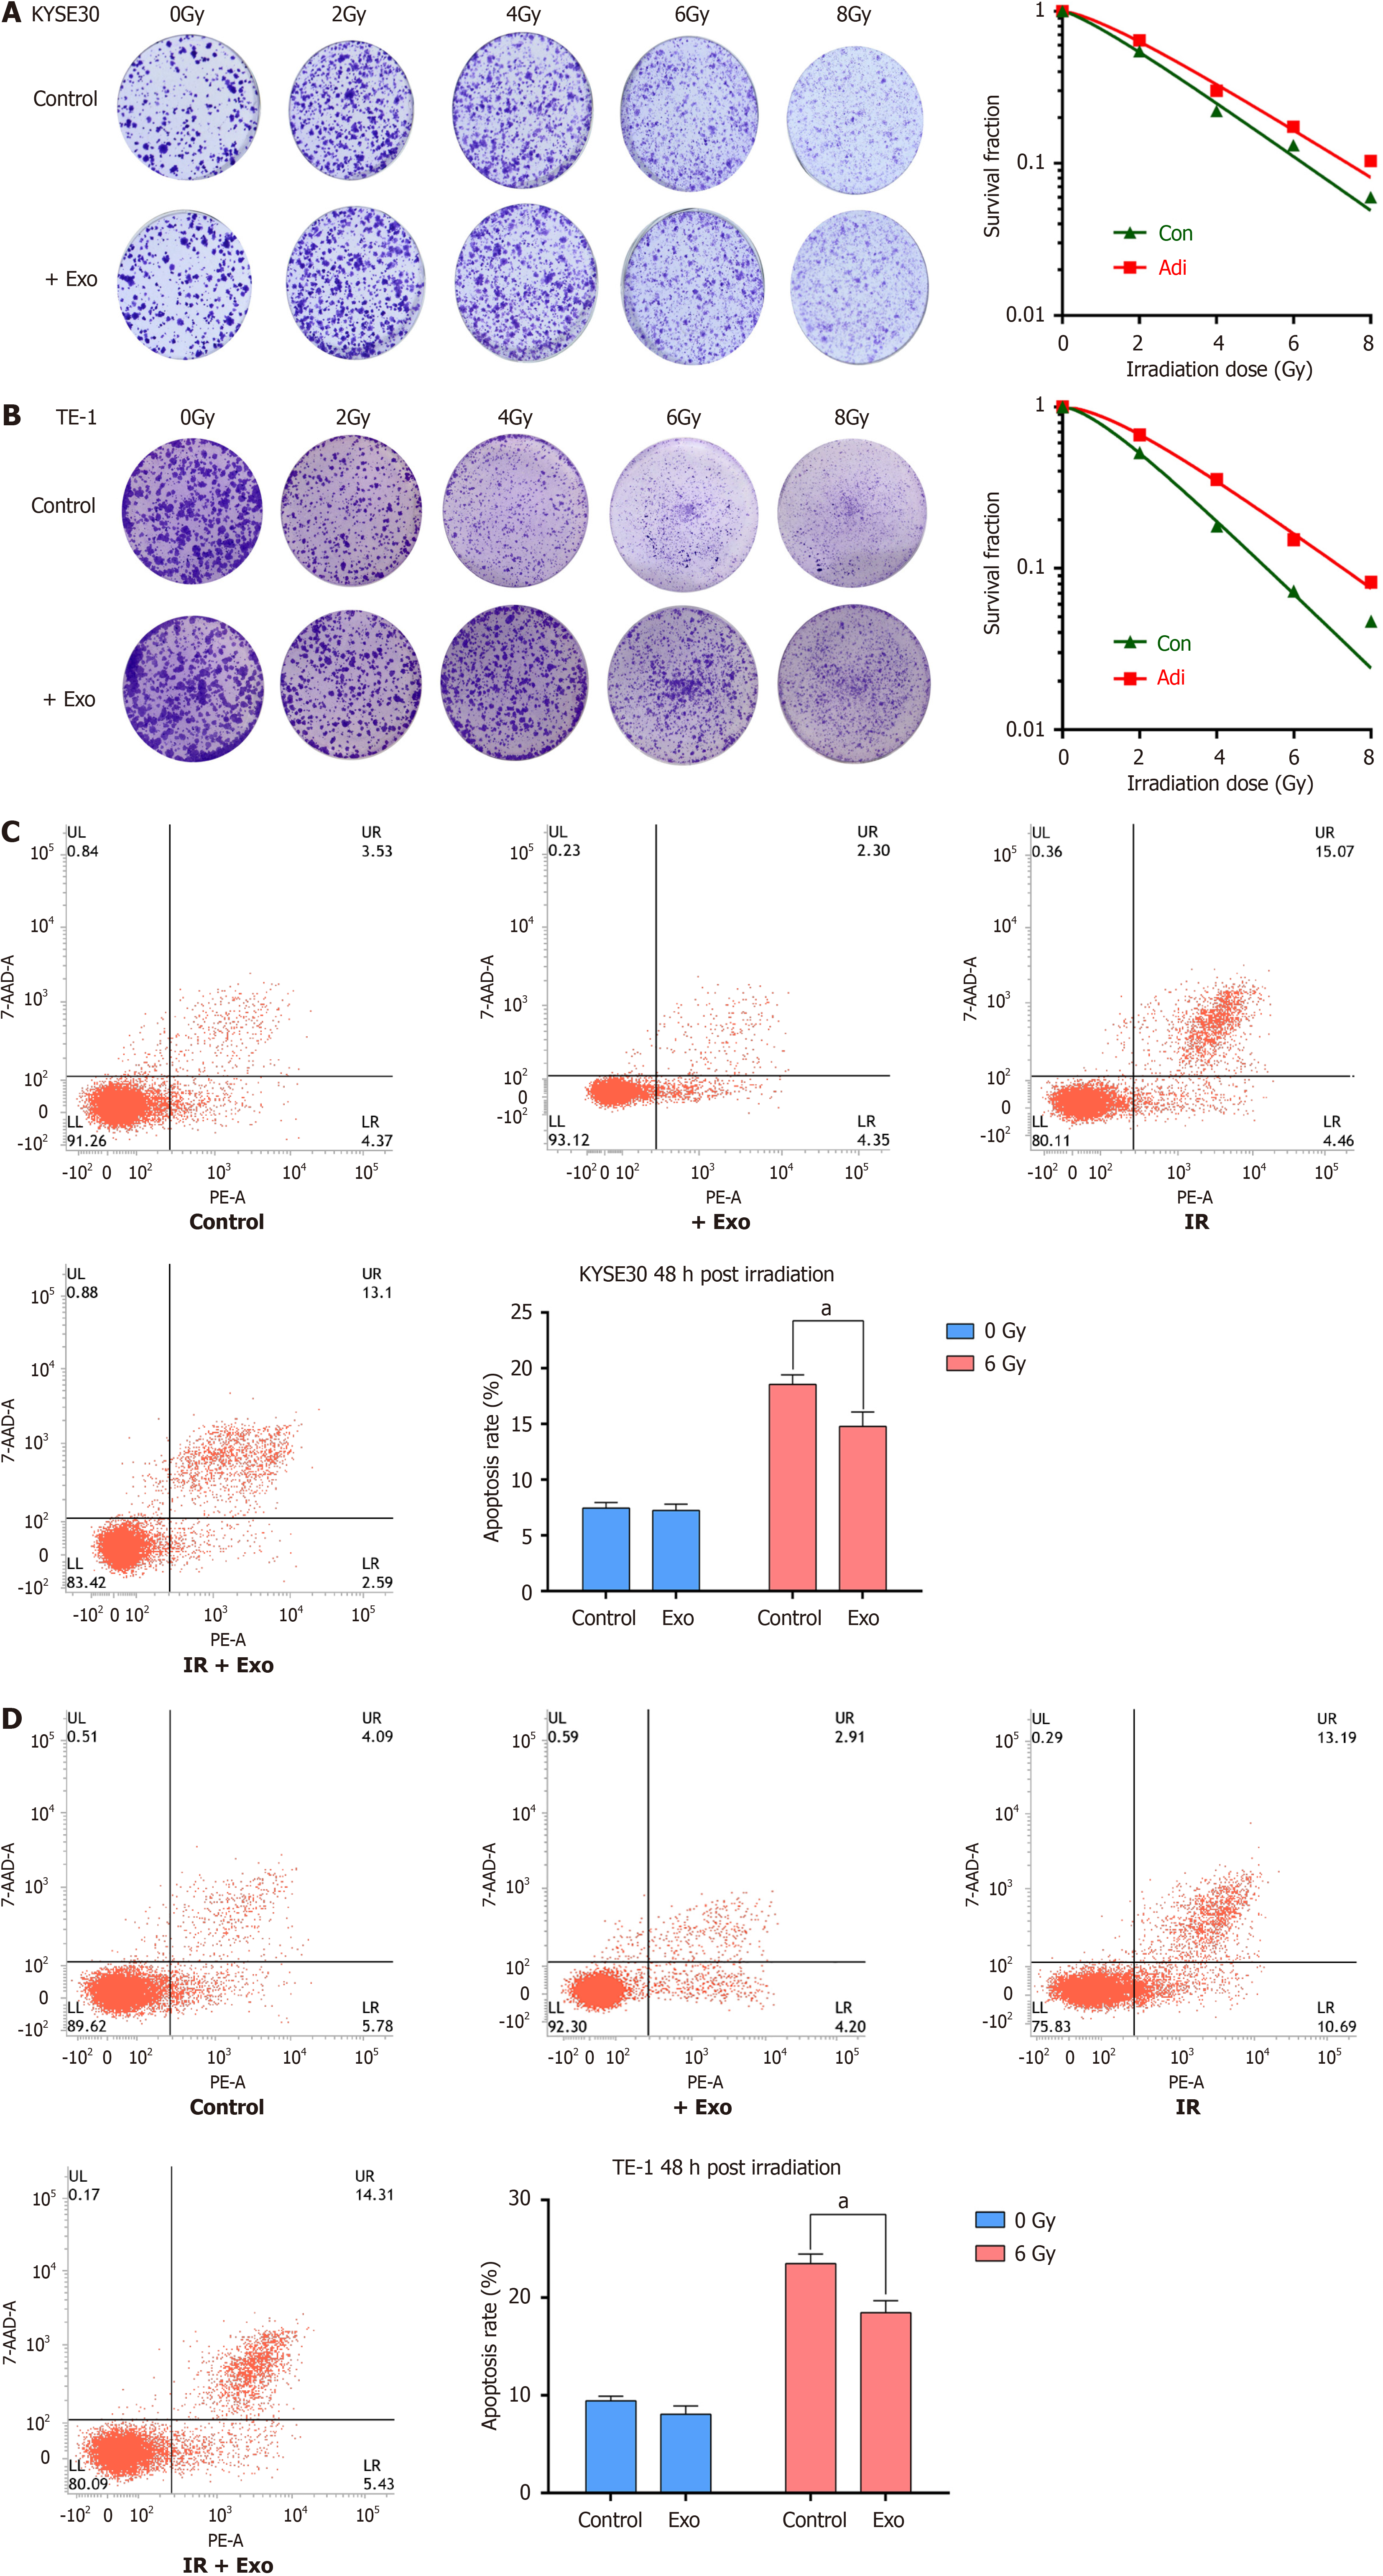
Figure 4 Radiation response and apoptosis in esophageal squamous cell carcinoma cells.
A and B: Radiation response and corresponding survival curves of the colony formation assay for KYSE30 (A) and TE-1 (B) cells; C and D: Flow cytometry analysis of apoptosis in KYSE30 (C) and TE-1 (D) cells, with the lower left quadrant representing live cells, the lower right quadrant representing early apoptosis, and the upper right quadrant representing late apoptosis. Accumulative cell apoptosis includes both early and late stages. Mean values from three independent experiments are presented and analyzed using the t-test. aP < 0.01.
- Citation: Ge YY, Xia XC, Wu AQ, Ma CY, Yu LH, Zhou JY. Identifying adipocyte-derived exosomal miRNAs as potential novel prognostic markers for radiotherapy of esophageal squamous cell carcinoma. World J Gastrointest Oncol 2025; 17(2): 98808
- URL: https://www.wjgnet.com/1948-5204/full/v17/i2/98808.htm
- DOI: https://dx.doi.org/10.4251/wjgo.v17.i2.98808


