Copyright
©The Author(s) 2025.
World J Gastrointest Oncol. Feb 15, 2025; 17(2): 98808
Published online Feb 15, 2025. doi: 10.4251/wjgo.v17.i2.98808
Published online Feb 15, 2025. doi: 10.4251/wjgo.v17.i2.98808
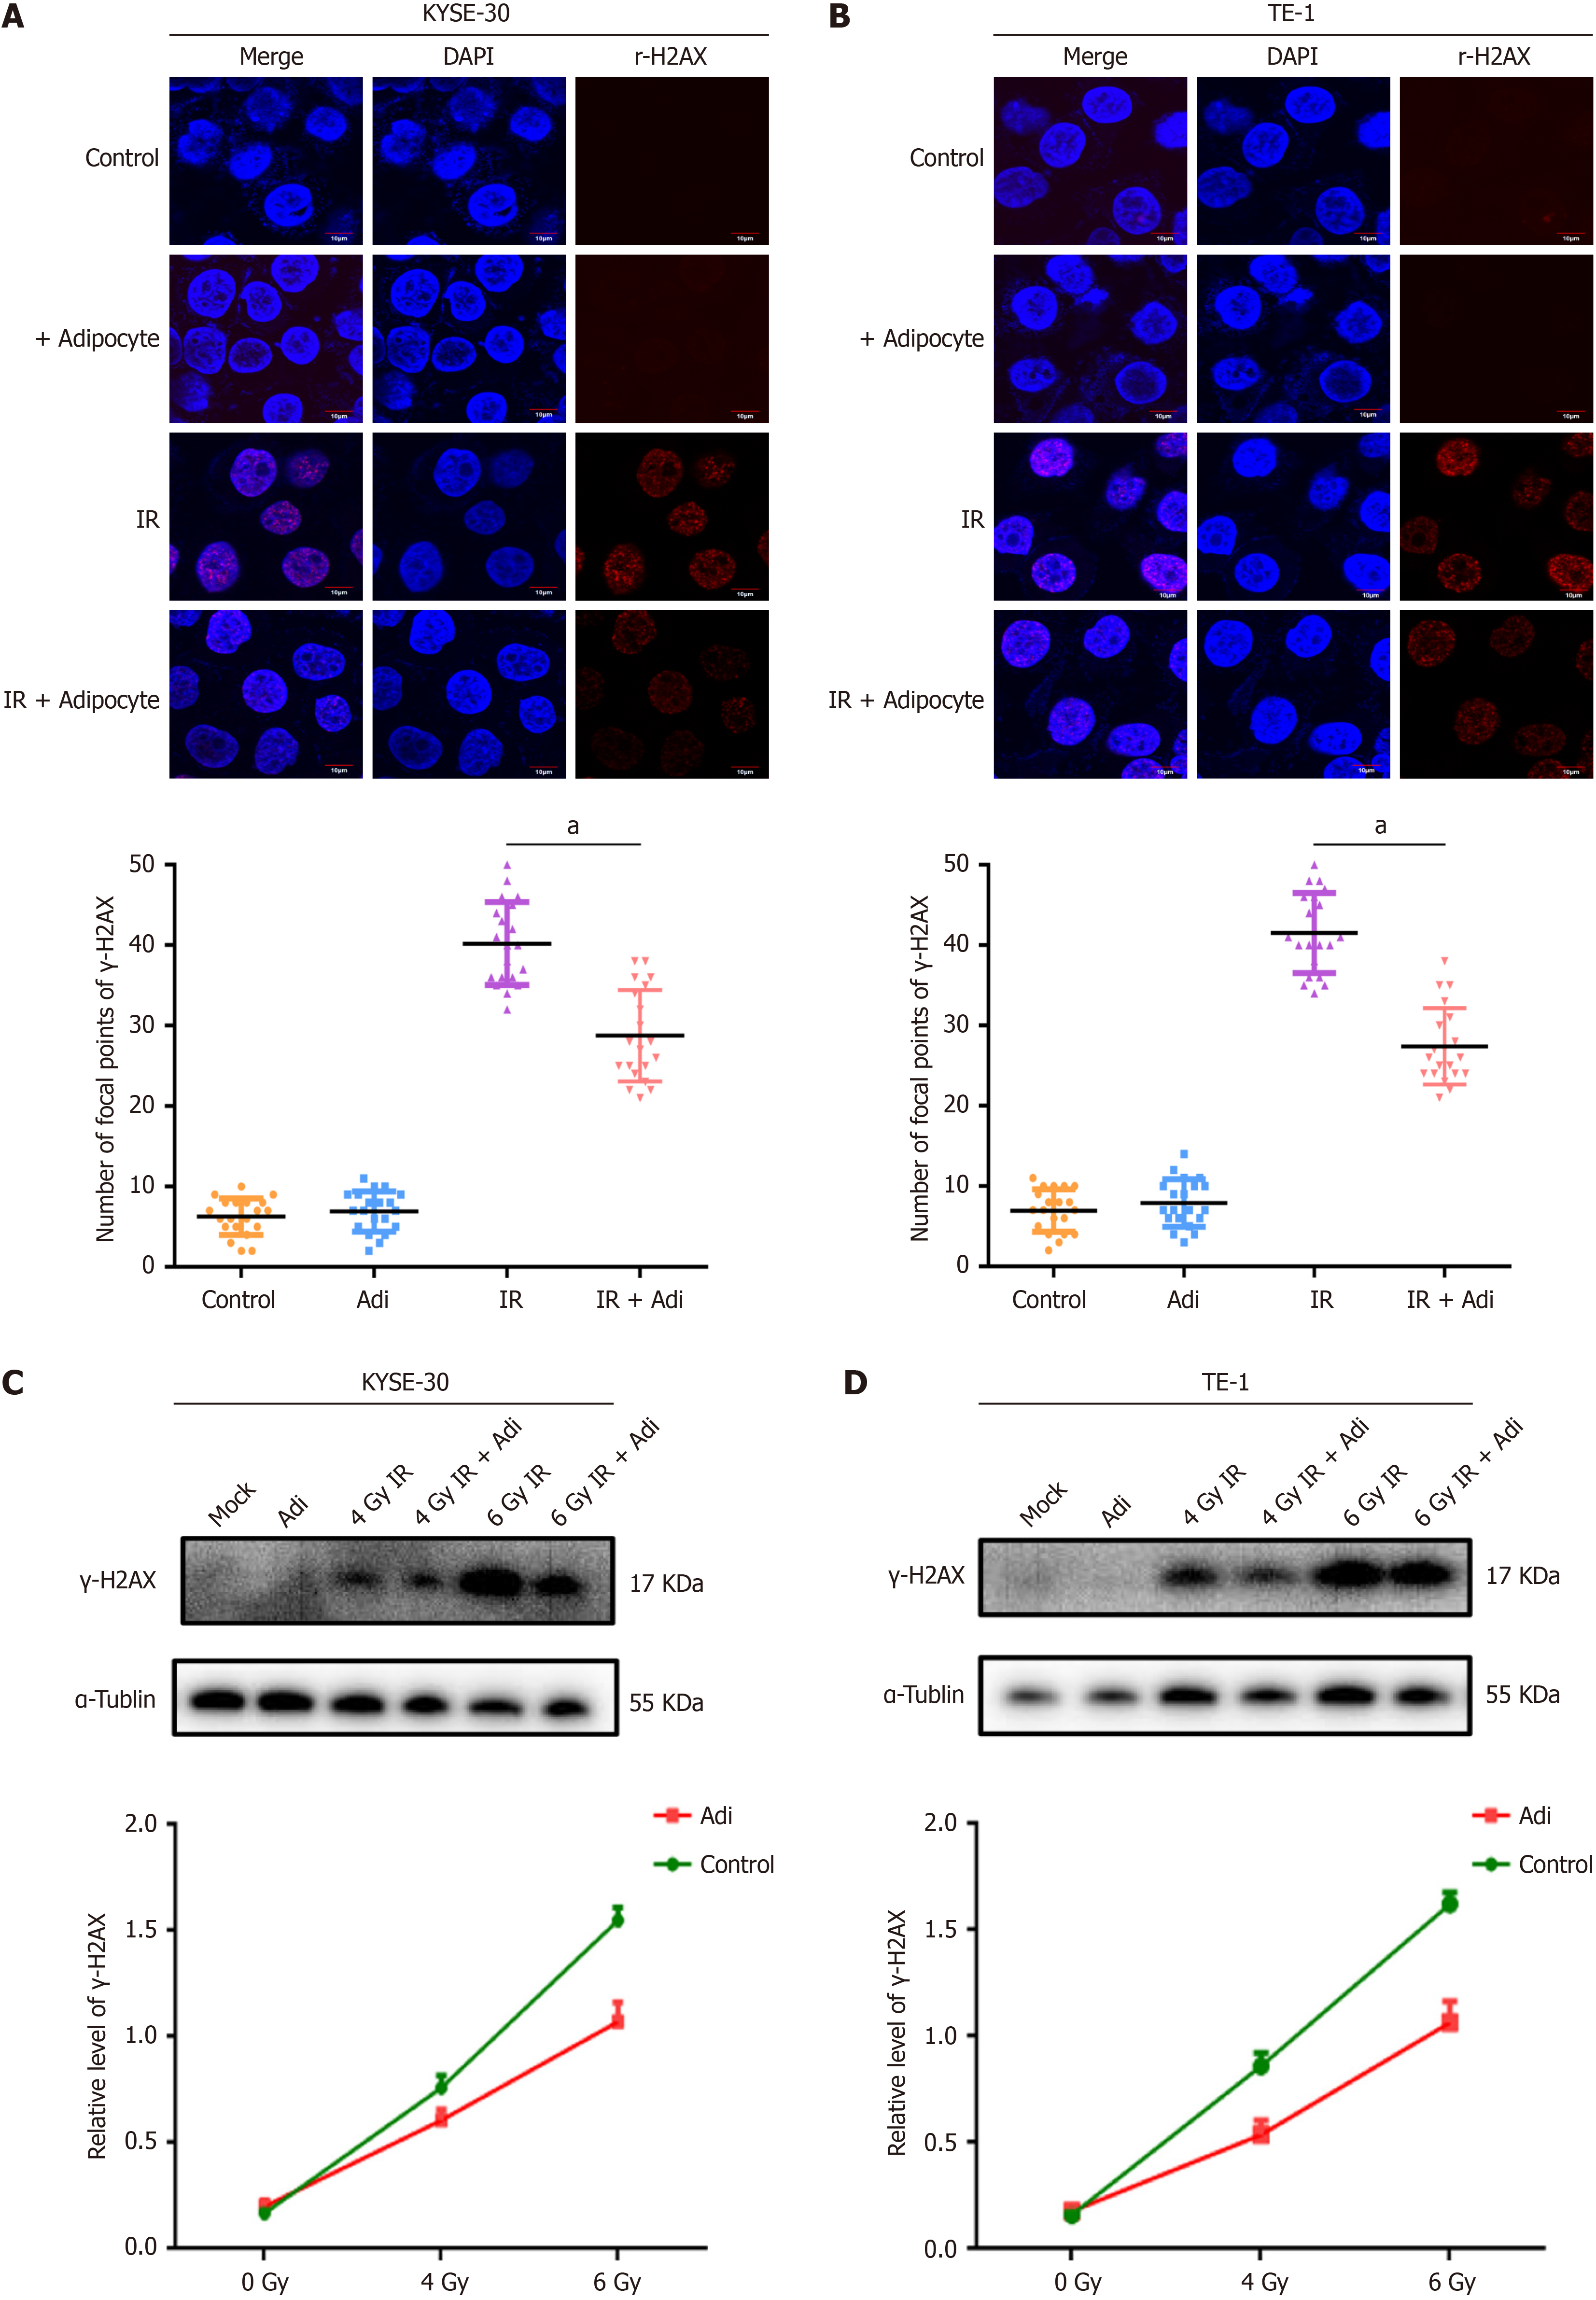
Figure 2 The confocal immunofluorescence staining images of KYSE30 and TE-1 cells (γ-H2AX labeled in red and nuclear staining in blue).
A: KYSE30; B: TE-1 cells. Quantitative analysis of γ-H2AX foci numbers is presented in a scatter plot (aP < 0.01); C and D: Results of Western blot analysis showing γ-H2AX protein levels in KYSE30 (C) and TE-1 cells (D) co-cultured with adipocytes and exposed to radiation, compared to the control group that received only irradiation.
- Citation: Ge YY, Xia XC, Wu AQ, Ma CY, Yu LH, Zhou JY. Identifying adipocyte-derived exosomal miRNAs as potential novel prognostic markers for radiotherapy of esophageal squamous cell carcinoma. World J Gastrointest Oncol 2025; 17(2): 98808
- URL: https://www.wjgnet.com/1948-5204/full/v17/i2/98808.htm
- DOI: https://dx.doi.org/10.4251/wjgo.v17.i2.98808


