Copyright
©The Author(s) 2025.
World J Gastrointest Oncol. Feb 15, 2025; 17(2): 97858
Published online Feb 15, 2025. doi: 10.4251/wjgo.v17.i2.97858
Published online Feb 15, 2025. doi: 10.4251/wjgo.v17.i2.97858
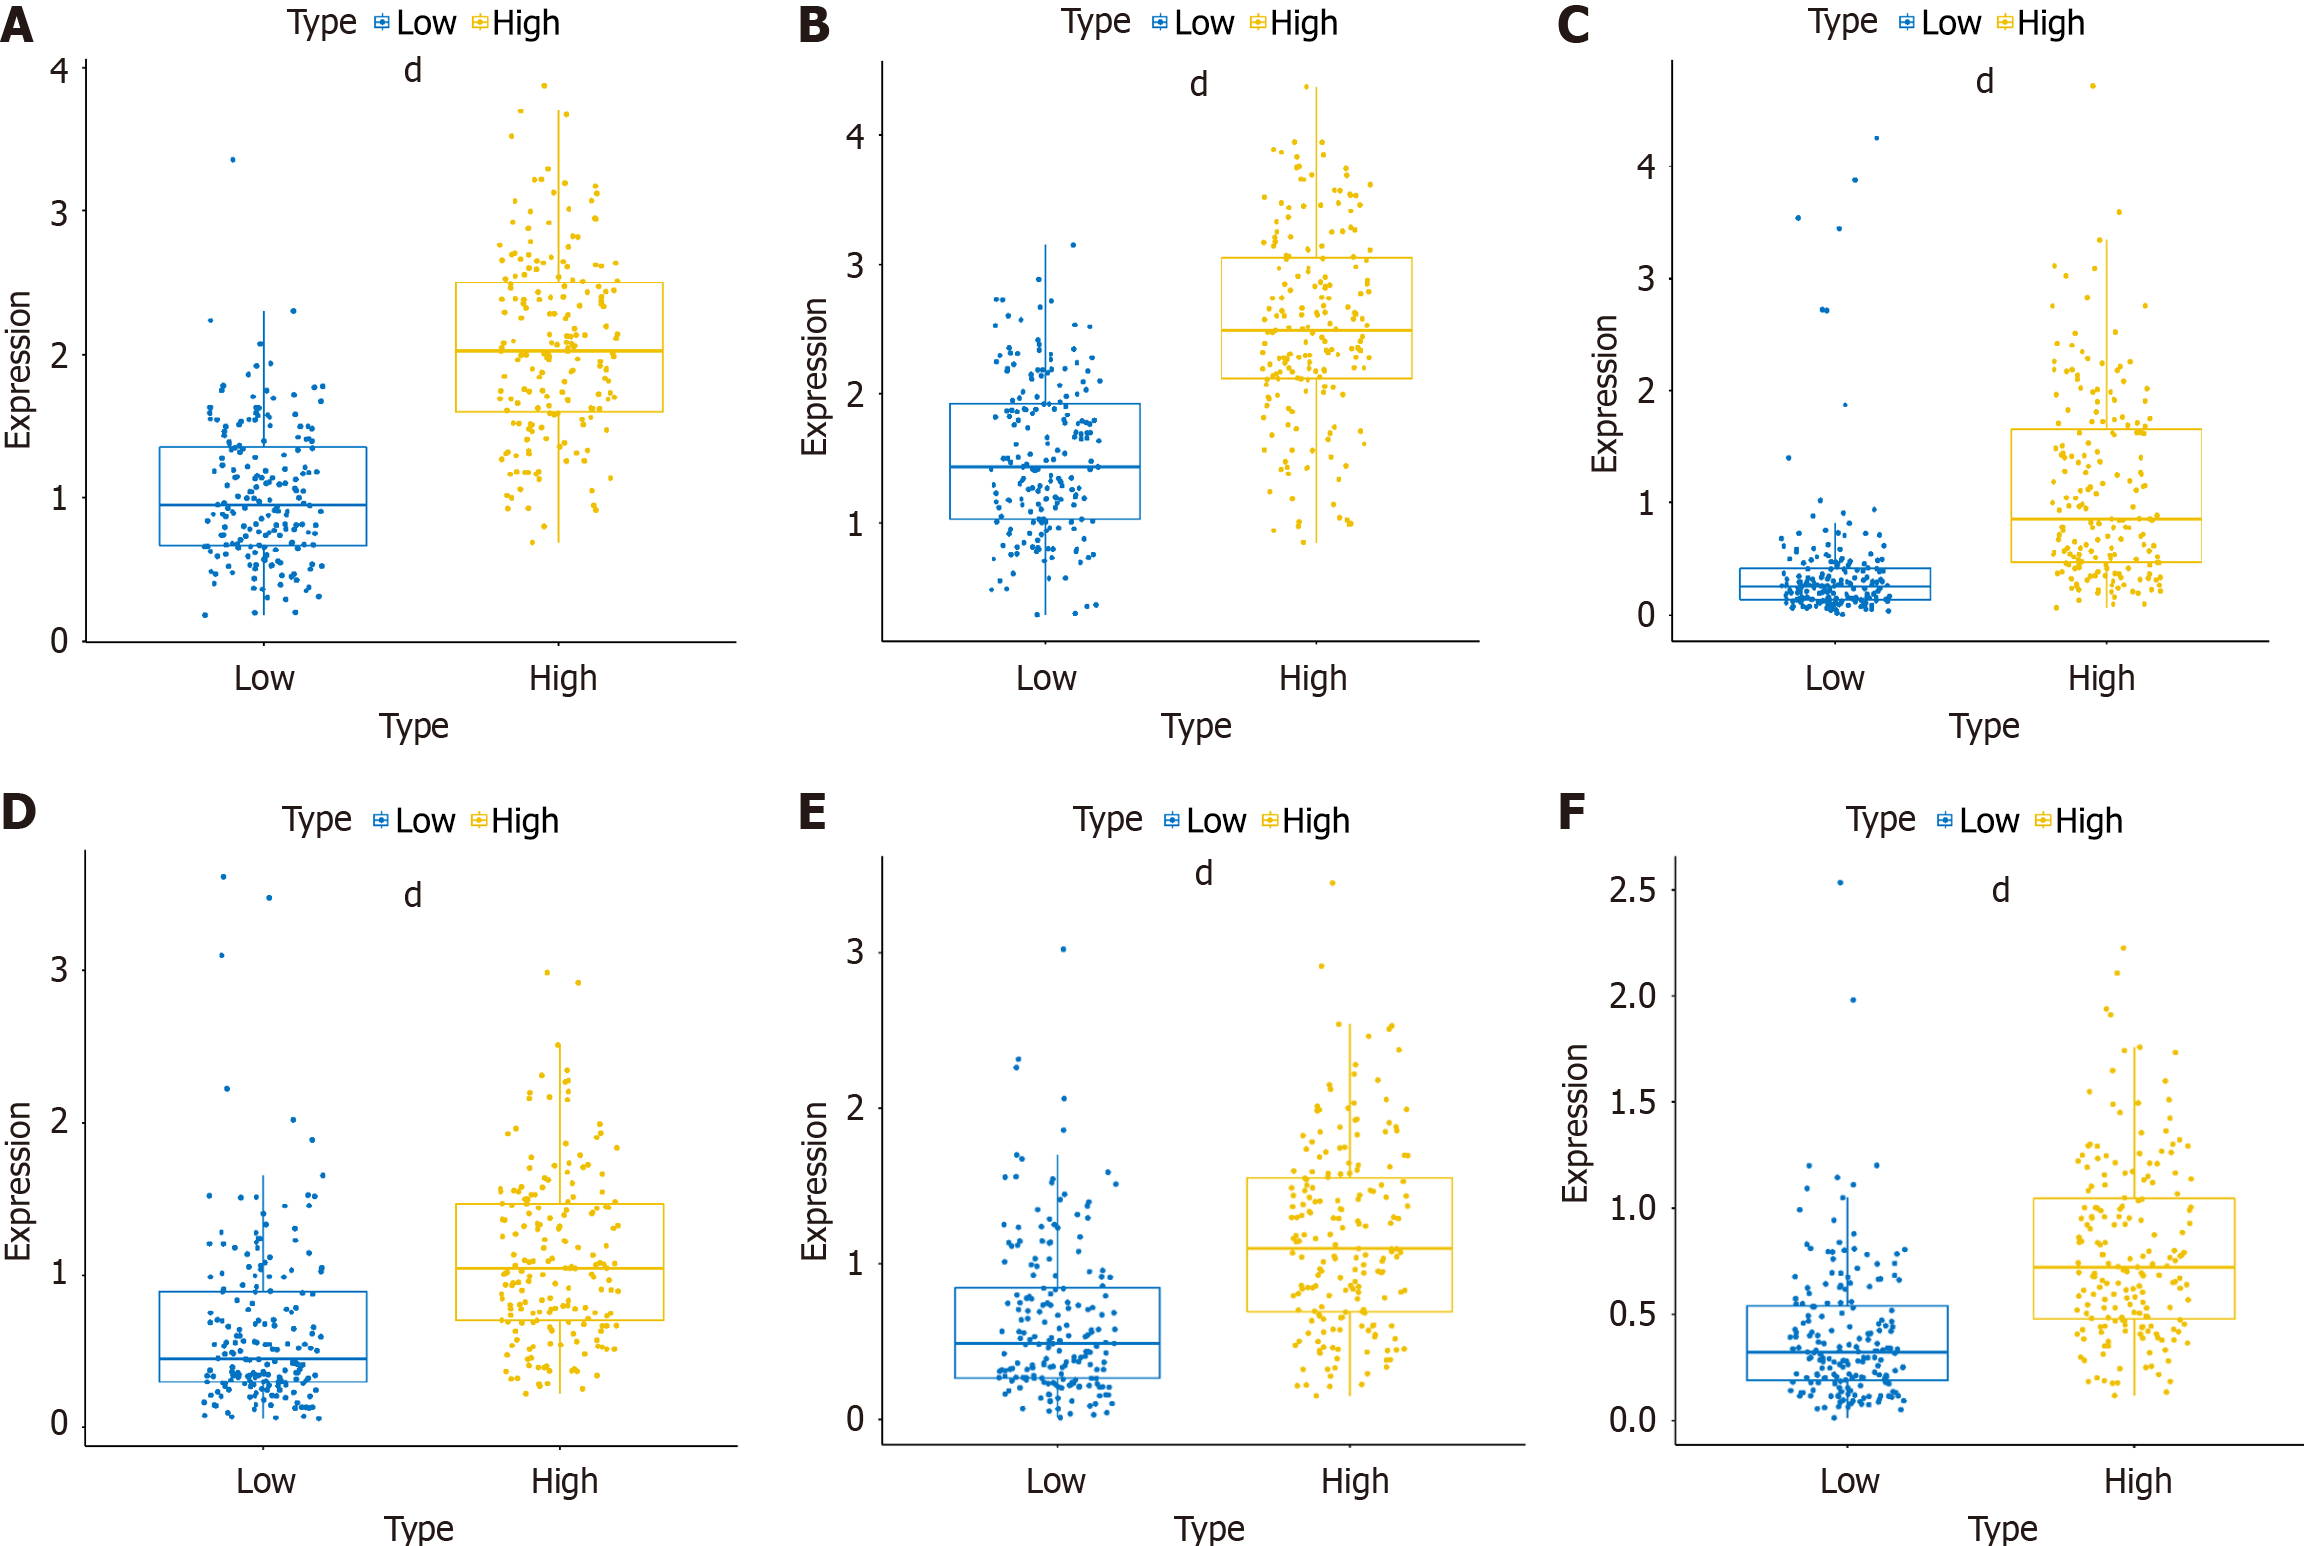
Figure 2 Immune checkpoints showing the most significant differences between high and low colony-stimulating factor 3 expression groups.
A: Leukocyte immunoglobulin-like receptor B2; B: Hepatitis A virus cellular receptor 2; C: Chemokine receptor 2; D: CD80; E: Inducible T-cell costimulator; F: CD28. dP < 0.0001.
- Citation: Wang L, Wu Q, Zhang ZW, Zhang H, Jin H, Zhou XL, Liu JY, Li D, Liu Y, Fan ZS. Colony-stimulating factor 3 and its receptor promote leukocyte immunoglobulin-like receptor B2 expression and ligands in gastric cancer. World J Gastrointest Oncol 2025; 17(2): 97858
- URL: https://www.wjgnet.com/1948-5204/full/v17/i2/97858.htm
- DOI: https://dx.doi.org/10.4251/wjgo.v17.i2.97858


