Copyright
©The Author(s) 2025.
World J Gastrointest Oncol. Feb 15, 2025; 17(2): 97858
Published online Feb 15, 2025. doi: 10.4251/wjgo.v17.i2.97858
Published online Feb 15, 2025. doi: 10.4251/wjgo.v17.i2.97858
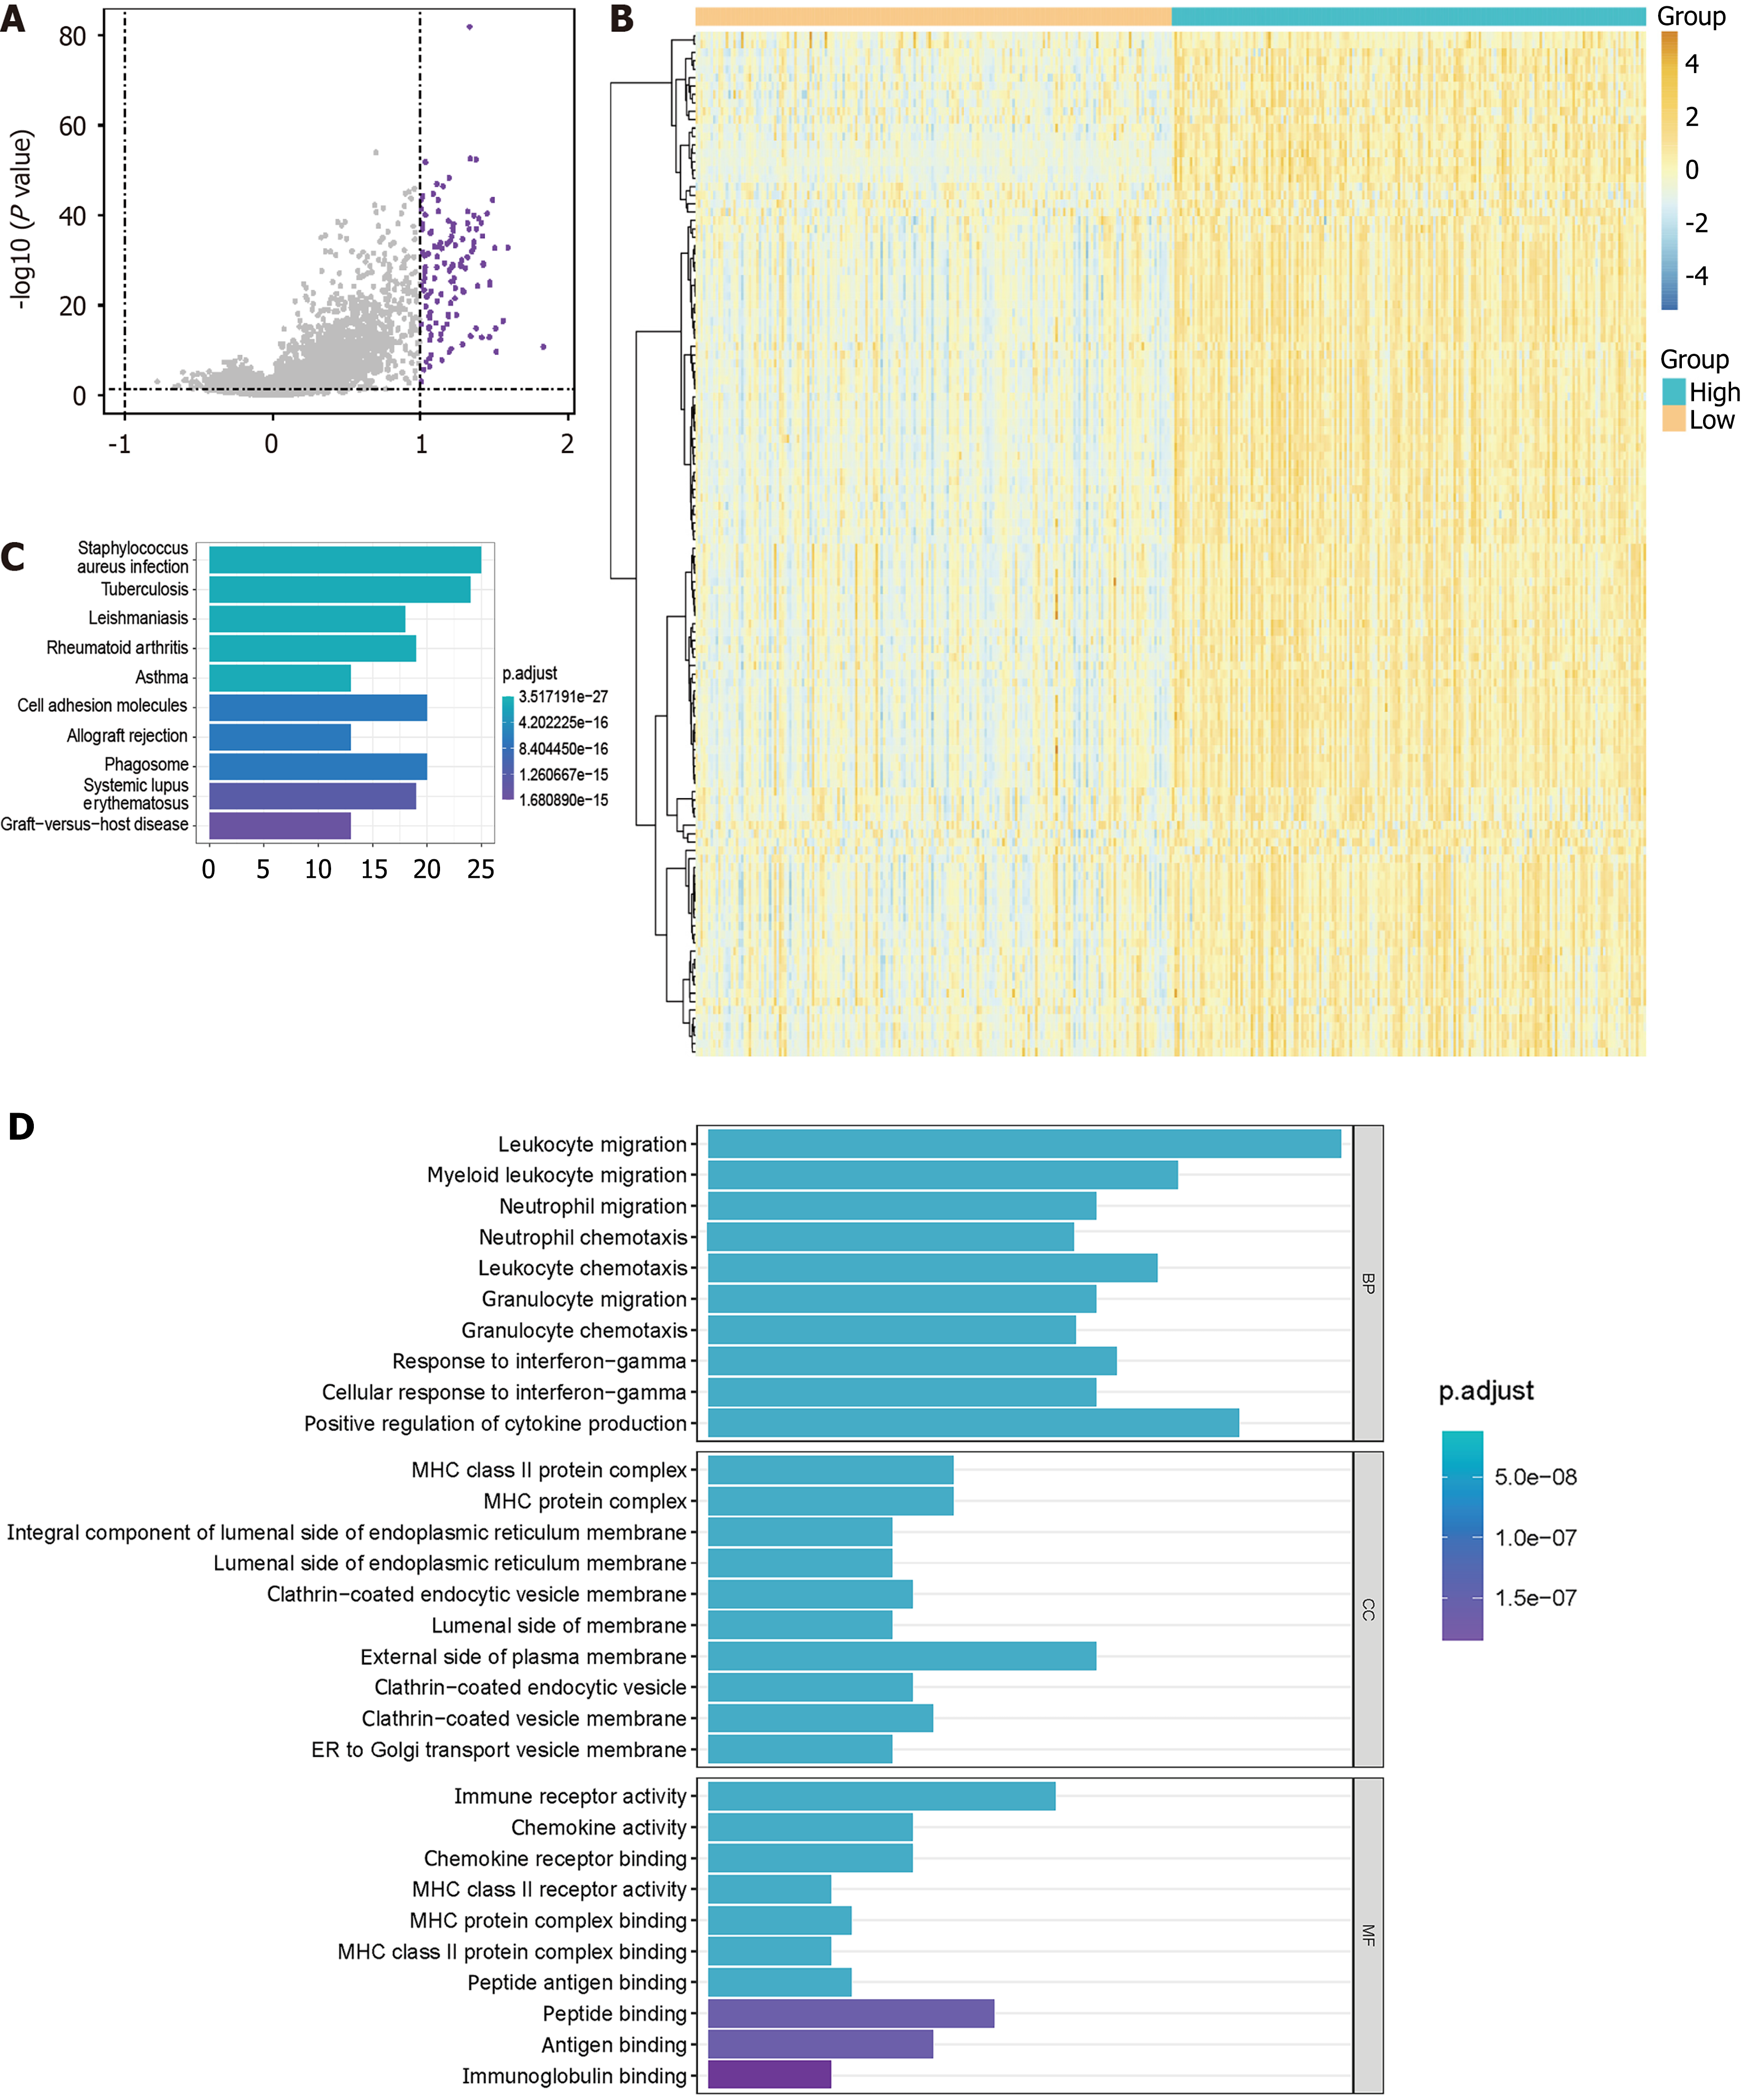
Figure 1 Analysis of differentially expressed genes between patients with high and low colony-stimulating factor 3 receptor expression.
A: Volcano plots of differentially expressed genes (DEGs); B: Heatmap of DEGs; C: Enrichment analysis of DEGs by Kyoto Encyclopedia of Genes and Genomes; D: Enrichment analysis of DEGs by Gene Ontology.
- Citation: Wang L, Wu Q, Zhang ZW, Zhang H, Jin H, Zhou XL, Liu JY, Li D, Liu Y, Fan ZS. Colony-stimulating factor 3 and its receptor promote leukocyte immunoglobulin-like receptor B2 expression and ligands in gastric cancer. World J Gastrointest Oncol 2025; 17(2): 97858
- URL: https://www.wjgnet.com/1948-5204/full/v17/i2/97858.htm
- DOI: https://dx.doi.org/10.4251/wjgo.v17.i2.97858


