Copyright
©The Author(s) 2025.
World J Gastrointest Oncol. Feb 15, 2025; 17(2): 97125
Published online Feb 15, 2025. doi: 10.4251/wjgo.v17.i2.97125
Published online Feb 15, 2025. doi: 10.4251/wjgo.v17.i2.97125
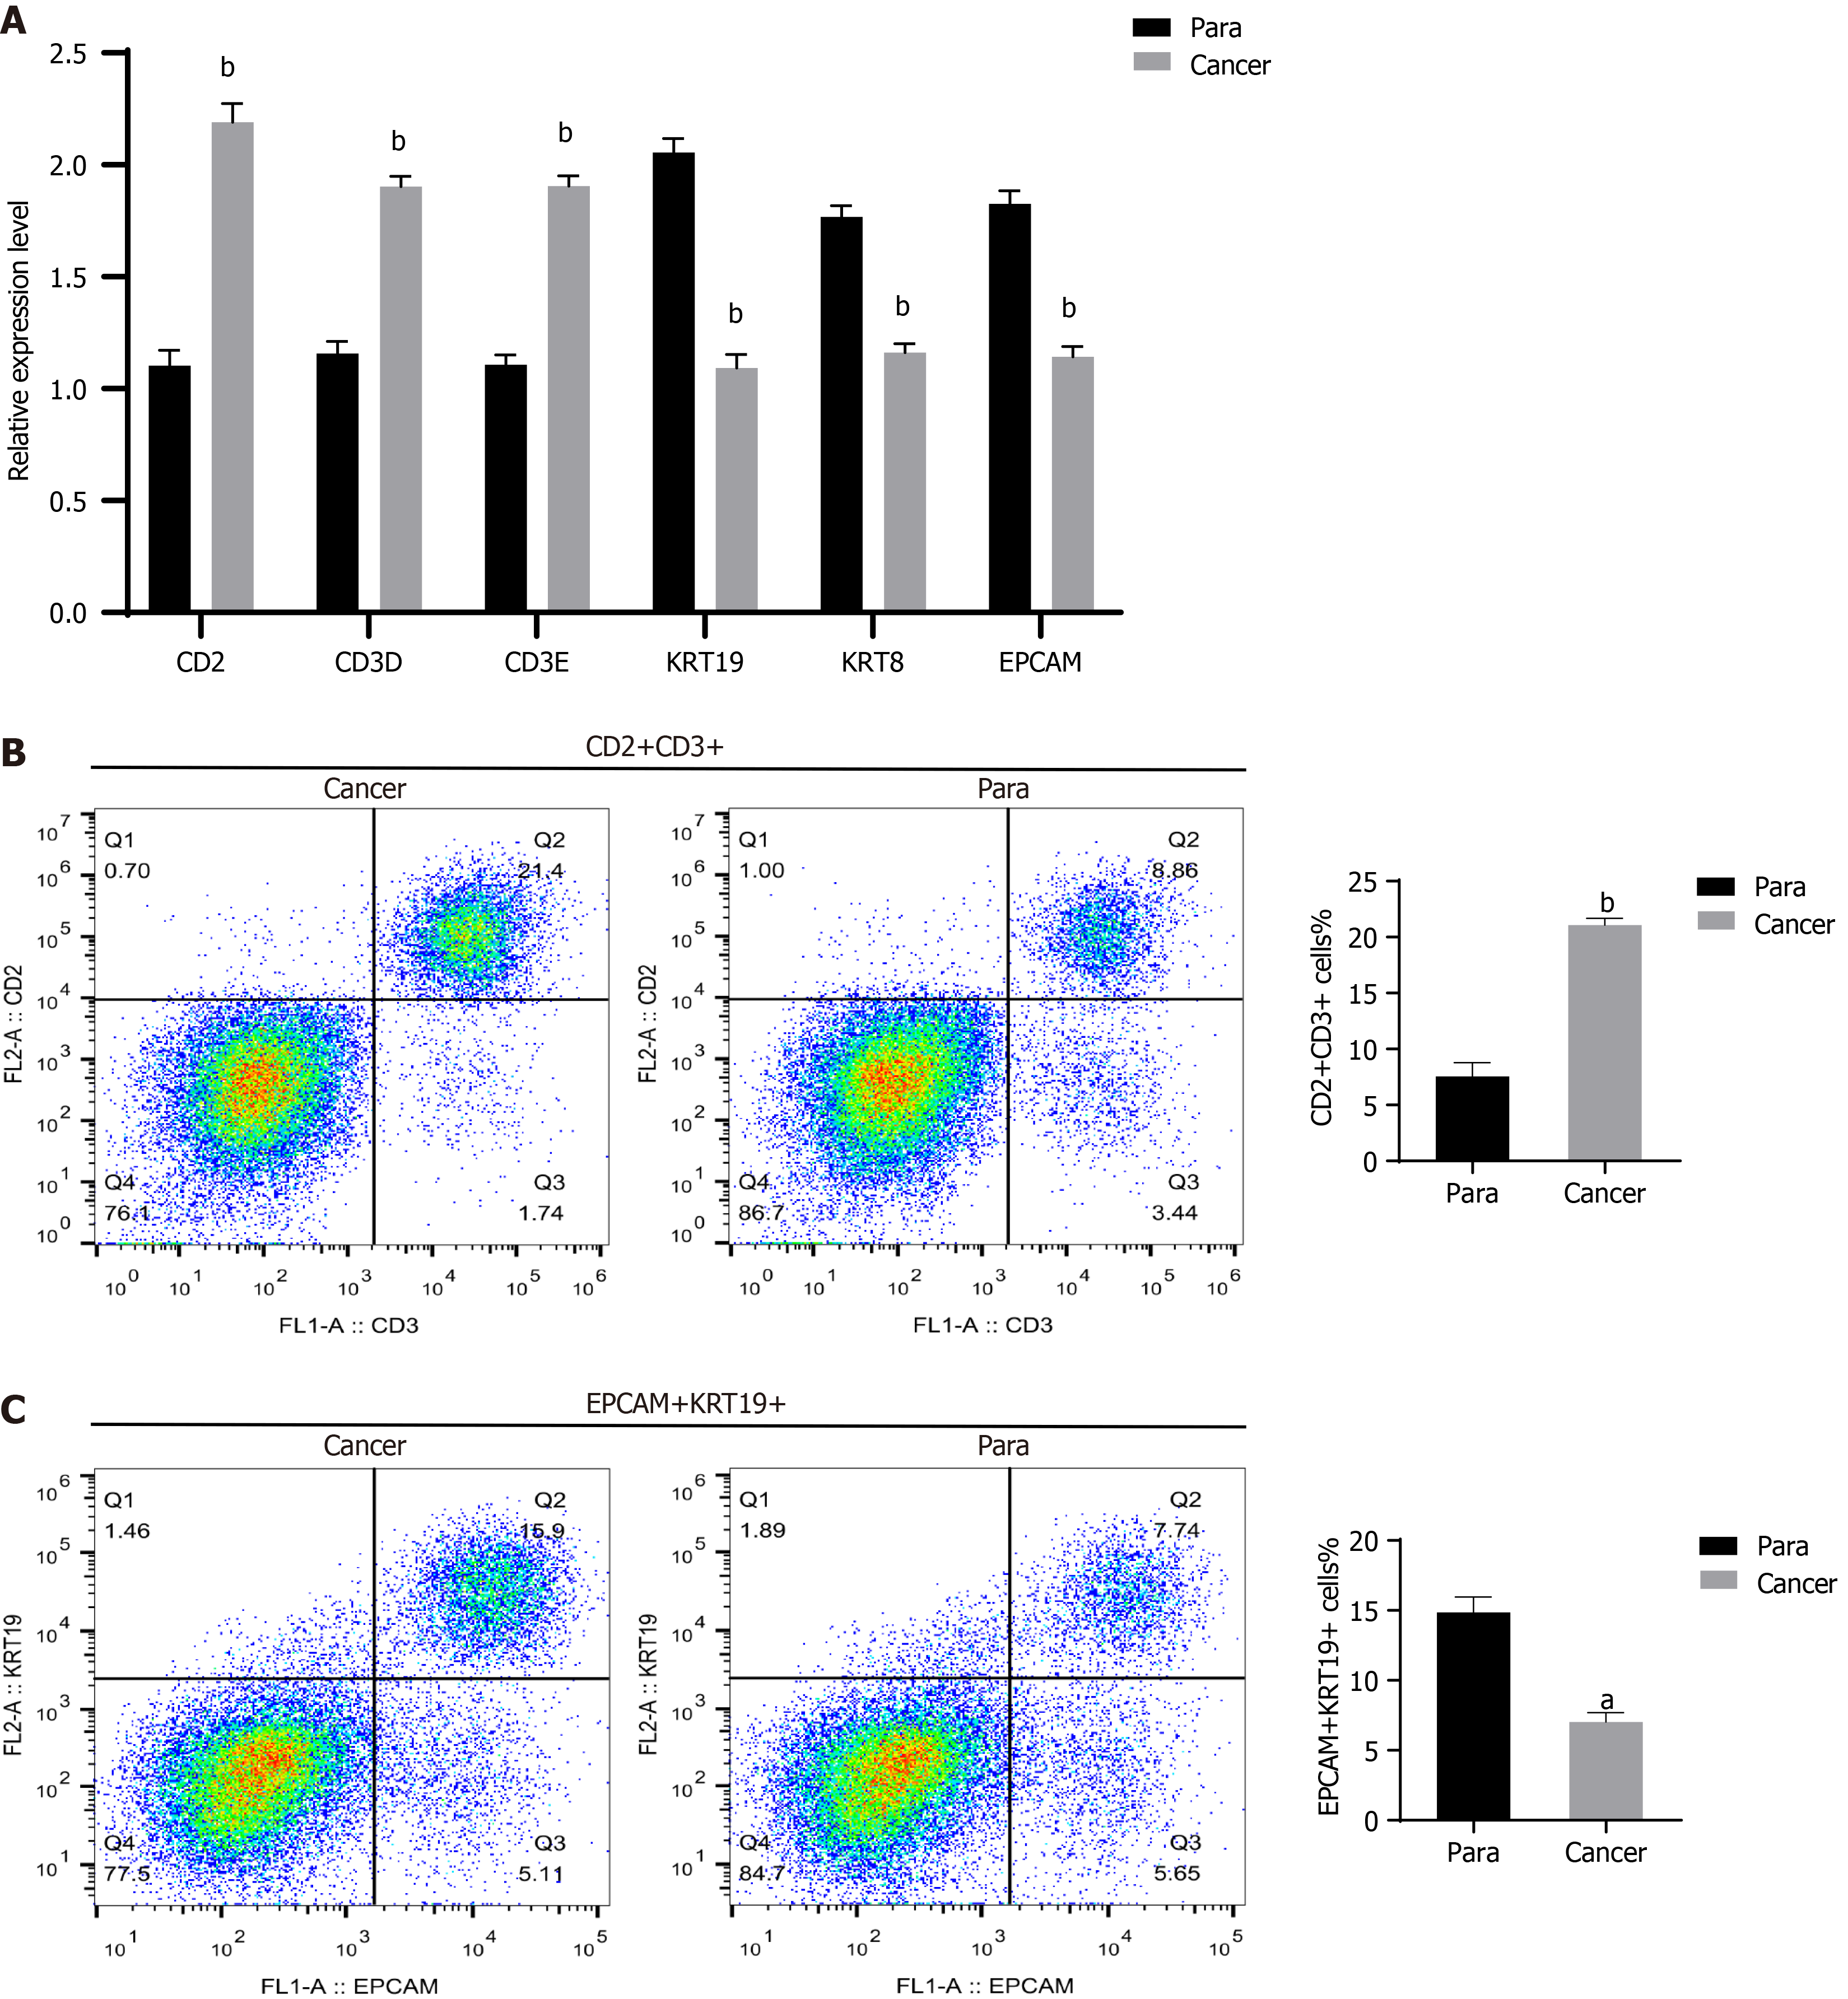
Figure 7 Trends in T cells and epithelial cells in gastric cancer tissues.
A: Quantitative real-time polymerase chain reaction for assessing the marker gene expression levels of T cells and epithelial cells; B and C: Flow cytometry for analyzing the quantities of T cell and epithelial cell marker genes. aP < 0.001, bP < 0.0001 vs para cancerous tissues.
- Citation: Tang XS, Xu CL, Li N, Zhang JQ, Tang Y. Landscape of four different stages of human gastric cancer revealed by single-cell sequencing. World J Gastrointest Oncol 2025; 17(2): 97125
- URL: https://www.wjgnet.com/1948-5204/full/v17/i2/97125.htm
- DOI: https://dx.doi.org/10.4251/wjgo.v17.i2.97125


